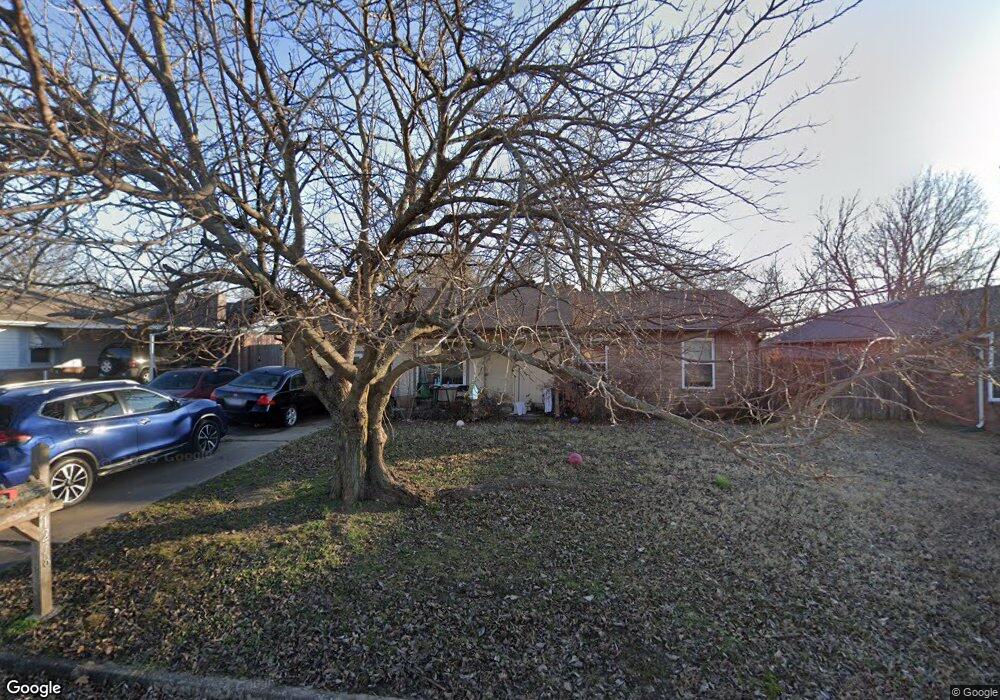
1278 E 144th St Glenpool, OK 74033
Estimated Value: $176,724 - $192,000
3
Beds
2
Baths
1,148
Sq Ft
$161/Sq Ft
Est. Value
About This Home
This home is located at 1278 E 144th St, Glenpool, OK 74033 and is currently estimated at $184,931, approximately $161 per square foot. 1278 E 144th St is a home located in Tulsa County with nearby schools including Glenpool Elementary School, Glenpool Middle School, and Glenpool High School.
Ownership History
Date
Name
Owned For
Owner Type
Purchase Details
Closed on
Jun 29, 2006
Sold by
Moura Properties Inc
Bought by
Moura Jose and Moura Noemia
Current Estimated Value
Purchase Details
Closed on
Jun 8, 2005
Sold by
Hud
Bought by
Moura Properties Inc
Home Financials for this Owner
Home Financials are based on the most recent Mortgage that was taken out on this home.
Original Mortgage
$45,665
Interest Rate
6.95%
Mortgage Type
Purchase Money Mortgage
Purchase Details
Closed on
Sep 18, 2000
Sold by
Evans Loren Jay and Evans Brenda Kay
Bought by
Green Kimberly Dawn
Home Financials for this Owner
Home Financials are based on the most recent Mortgage that was taken out on this home.
Original Mortgage
$74,762
Interest Rate
8.01%
Mortgage Type
FHA
Create a Home Valuation Report for This Property
The Home Valuation Report is an in-depth analysis detailing your home's value as well as a comparison with similar homes in the area
Home Values in the Area
Average Home Value in this Area
Purchase History
| Date | Buyer | Sale Price | Title Company |
|---|---|---|---|
| Moura Jose | -- | None Available | |
| Moura Properties Inc | -- | First American Title & Abstr | |
| Green Kimberly Dawn | $75,000 | -- |
Source: Public Records
Mortgage History
| Date | Status | Borrower | Loan Amount |
|---|---|---|---|
| Previous Owner | Moura Properties Inc | $45,665 | |
| Previous Owner | Green Kimberly Dawn | $74,762 |
Source: Public Records
Tax History
| Year | Tax Paid | Tax Assessment Tax Assessment Total Assessment is a certain percentage of the fair market value that is determined by local assessors to be the total taxable value of land and additions on the property. | Land | Improvement |
|---|---|---|---|---|
| 2025 | $1,627 | $13,567 | $1,328 | $12,239 |
| 2024 | $1,441 | $12,921 | $1,455 | $11,466 |
| 2023 | $1,441 | $12,306 | $1,454 | $10,852 |
| 2022 | $1,351 | $11,720 | $1,814 | $9,906 |
| 2021 | $1,306 | $11,161 | $1,727 | $9,434 |
| 2020 | $1,281 | $10,869 | $1,682 | $9,187 |
| 2019 | $1,229 | $10,352 | $1,602 | $8,750 |
| 2018 | $1,165 | $9,859 | $1,526 | $8,333 |
| 2017 | $1,087 | $9,399 | $1,455 | $7,944 |
| 2016 | $1,046 | $8,952 | $1,502 | $7,450 |
| 2015 | $991 | $8,525 | $1,430 | $7,095 |
| 2014 | $995 | $8,525 | $1,430 | $7,095 |
Source: Public Records
Map
Nearby Homes
- 1188 E 143rd St
- 1122 E 144th Place
- 243 E 141st St
- 1417 E 145th St S
- 13827 S Quincy St
- 1671 E 140th St
- 1019 E 146th St S
- 14619 S Maple Place
- 1664 E 138th St S
- 1172 E 148th St S
- 13816 S Iroquois Ave E
- 13761 S Nyssa Ct
- 1655 E 139th Ct
- 1104 E 137th St
- 13925 S Kenosha Ave
- 1159 E 137th St
- 1665 E 138th Place S
- 14037 S Glen St
- 13659 S Quincy St
- 13672 S Kenosha Ave
- 1260 E 144th St
- 1284 E 144th St
- 1256 E 144th St
- 1290 E 144th St
- 14426 S Oak St
- 14459 S Kendalwood Blvd
- 1273 E 144th St
- 14461 S Kendalwood Blvd
- 1265 E 144th St
- 14448 S Oak St
- 1238 E 144th St
- 1289 E 144th St
- 14443 S Kendalwood Blvd
- 14406 S Oak St
- 1247 E 144th St
- 1301 E 144th St
- 14483 S Kendalwood Blvd
- 14450 S Oak St
- 14401 S Oak St
- 1223 E 144th St
Your Personal Tour Guide
Ask me questions while you tour the home.