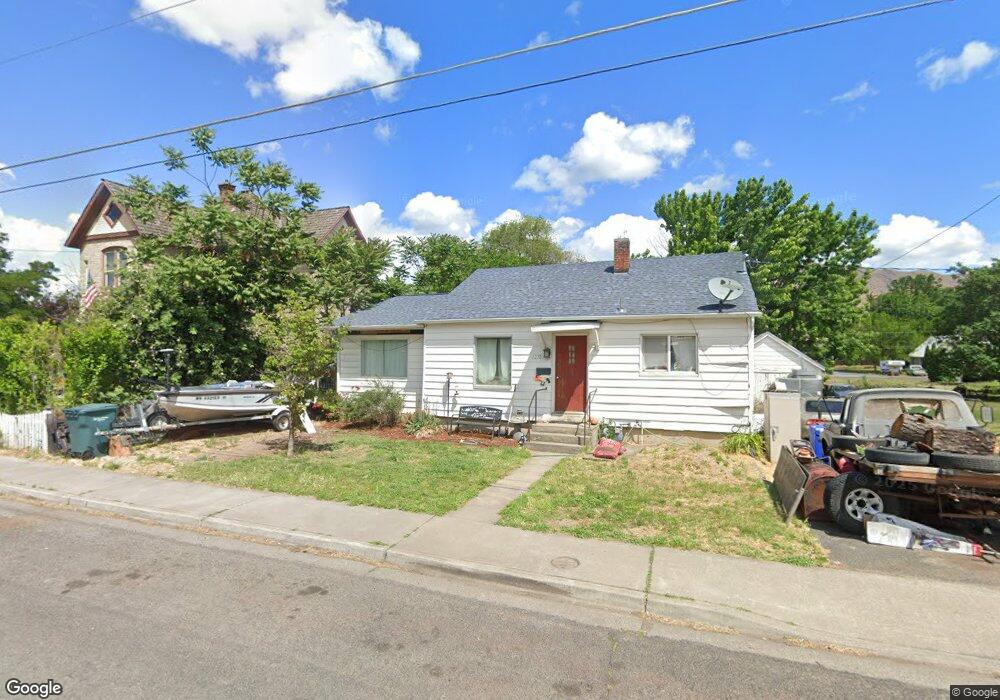
1278 Elm St Clarkston, WA 99403
Estimated Value: $254,000 - $289,696
--
Bed
--
Bath
1,012
Sq Ft
$270/Sq Ft
Est. Value
About This Home
This home is located at 1278 Elm St, Clarkston, WA 99403 and is currently estimated at $272,924, approximately $269 per square foot. 1278 Elm St is a home located in Asotin County with nearby schools including Grantham Elementary School, Lincoln Middle School, and Charles Francis Adams High School.
Ownership History
Date
Name
Owned For
Owner Type
Purchase Details
Closed on
Apr 17, 2020
Sold by
Roberts Brian Averne
Bought by
Roberts Elissa Kate and Moser Elissa Kate
Current Estimated Value
Purchase Details
Closed on
Sep 29, 2009
Sold by
Bank Of America Na
Bought by
Moser Elissa K
Home Financials for this Owner
Home Financials are based on the most recent Mortgage that was taken out on this home.
Original Mortgage
$103,428
Outstanding Balance
$67,261
Interest Rate
5%
Mortgage Type
FHA
Estimated Equity
$205,663
Purchase Details
Closed on
Mar 31, 2009
Sold by
Albrecht Amanda L
Bought by
Bank Of America Na
Create a Home Valuation Report for This Property
The Home Valuation Report is an in-depth analysis detailing your home's value as well as a comparison with similar homes in the area
Home Values in the Area
Average Home Value in this Area
Purchase History
| Date | Buyer | Sale Price | Title Company |
|---|---|---|---|
| Roberts Elissa Kate | -- | None Available | |
| Moser Elissa K | $105,337 | Alliance Title & Escrow | |
| Bank Of America Na | $83,627 | None Available |
Source: Public Records
Mortgage History
| Date | Status | Borrower | Loan Amount |
|---|---|---|---|
| Open | Moser Elissa K | $103,428 |
Source: Public Records
Tax History Compared to Growth
Tax History
| Year | Tax Paid | Tax Assessment Tax Assessment Total Assessment is a certain percentage of the fair market value that is determined by local assessors to be the total taxable value of land and additions on the property. | Land | Improvement |
|---|---|---|---|---|
| 2025 | $1,696 | $145,800 | $30,000 | $115,800 |
| 2023 | $1,696 | $145,800 | $30,000 | $115,800 |
| 2022 | $1,675 | $145,800 | $30,000 | $115,800 |
| 2021 | $1,650 | $145,800 | $30,000 | $115,800 |
| 2020 | $1,474 | $130,900 | $35,000 | $95,900 |
| 2019 | $1,425 | $130,900 | $35,000 | $95,900 |
| 2018 | $1,723 | $130,900 | $35,000 | $95,900 |
| 2017 | $1,614 | $130,900 | $35,000 | $95,900 |
| 2016 | $1,614 | $130,900 | $35,000 | $95,900 |
| 2015 | $160 | $125,500 | $35,000 | $90,500 |
| 2013 | $1,599 | $122,900 | $35,000 | $87,900 |
Source: Public Records
Map
Nearby Homes