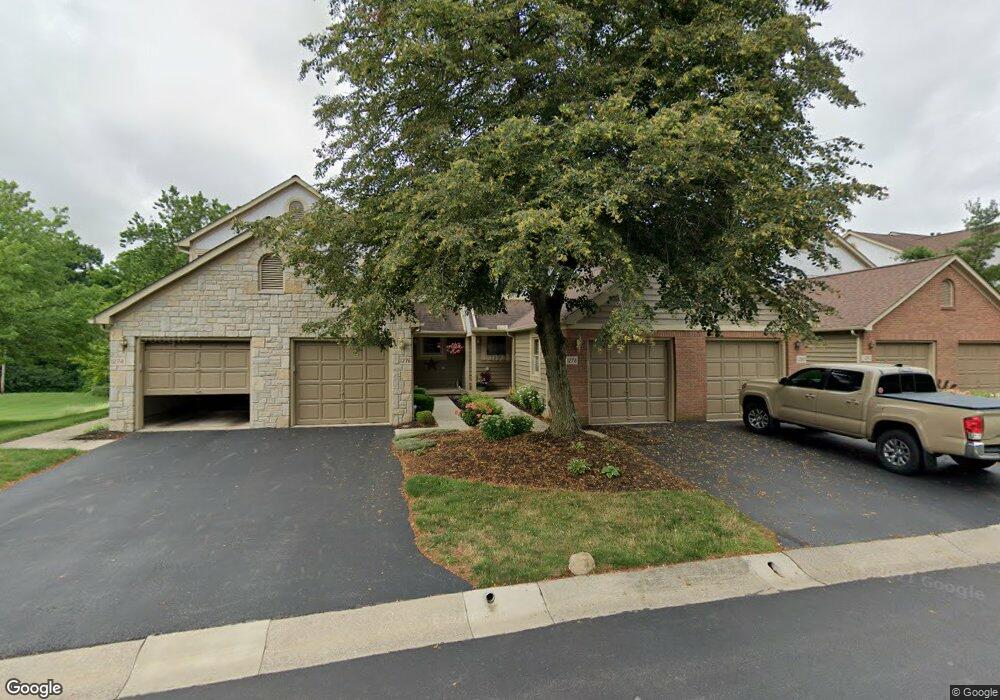
1278 Spring Brook Ct Unit 1278 Westerville, OH 43081
Estimated Value: $253,066 - $262,000
2
Beds
3
Baths
1,535
Sq Ft
$169/Sq Ft
Est. Value
About This Home
This home is located at 1278 Spring Brook Ct Unit 1278, Westerville, OH 43081 and is currently estimated at $259,517, approximately $169 per square foot. 1278 Spring Brook Ct Unit 1278 is a home located in Franklin County with nearby schools including Mcvay Elementary School, Walnut Springs Middle School, and Westerville Central High School.
Ownership History
Date
Name
Owned For
Owner Type
Purchase Details
Closed on
Feb 19, 2019
Sold by
Hugel Jeffrey C and Hugel Susan S
Bought by
Thomas Sharon S and Trust Of Sharon S Thomas
Current Estimated Value
Home Financials for this Owner
Home Financials are based on the most recent Mortgage that was taken out on this home.
Original Mortgage
$170,000
Outstanding Balance
$48,363
Interest Rate
4.4%
Mortgage Type
Purchase Money Mortgage
Estimated Equity
$211,154
Purchase Details
Closed on
Jul 11, 2018
Sold by
Darling William S and Darling Kathryn F
Bought by
Hugel Jeffrey C and Hugel Susan S
Purchase Details
Closed on
Jun 27, 2011
Sold by
Mesaros Barbara B
Bought by
Darlin William S and Darling Kathryn F
Purchase Details
Closed on
May 4, 2007
Sold by
Mesaros Barbara B
Bought by
Mesaros Barbara B
Purchase Details
Closed on
Jul 14, 2004
Sold by
Mesaros Joel
Bought by
Mesaros Barbara B
Purchase Details
Closed on
Apr 26, 1990
Bought by
Mesaros Joel and Mesaros Barbara B
Create a Home Valuation Report for This Property
The Home Valuation Report is an in-depth analysis detailing your home's value as well as a comparison with similar homes in the area
Home Values in the Area
Average Home Value in this Area
Purchase History
| Date | Buyer | Sale Price | Title Company |
|---|---|---|---|
| Thomas Sharon S | $170,000 | Chicago Title | |
| Hugel Jeffrey C | $170,000 | Chicago Title | |
| Darlin William S | $120,000 | Real Living | |
| Mesaros Barbara B | -- | Attorney | |
| Mesaros Barbara B | -- | -- | |
| Mesaros Joel | $92,000 | -- |
Source: Public Records
Mortgage History
| Date | Status | Borrower | Loan Amount |
|---|---|---|---|
| Open | Thomas Sharon S | $170,000 |
Source: Public Records
Tax History Compared to Growth
Tax History
| Year | Tax Paid | Tax Assessment Tax Assessment Total Assessment is a certain percentage of the fair market value that is determined by local assessors to be the total taxable value of land and additions on the property. | Land | Improvement |
|---|---|---|---|---|
| 2024 | $4,048 | $71,230 | $14,530 | $56,700 |
| 2023 | $3,962 | $71,225 | $14,525 | $56,700 |
| 2022 | $4,154 | $57,020 | $7,670 | $49,350 |
| 2021 | $4,189 | $57,020 | $7,670 | $49,350 |
| 2020 | $4,177 | $57,020 | $7,670 | $49,350 |
| 2019 | $3,948 | $49,560 | $6,650 | $42,910 |
| 2018 | $3,733 | $49,560 | $6,650 | $42,910 |
| 2017 | $3,796 | $49,560 | $6,650 | $42,910 |
| 2016 | $3,706 | $43,020 | $7,180 | $35,840 |
| 2015 | $3,593 | $43,020 | $7,180 | $35,840 |
| 2014 | $3,596 | $43,020 | $7,180 | $35,840 |
| 2013 | $1,995 | $47,810 | $7,980 | $39,830 |
Source: Public Records
Map
Nearby Homes
- 5888 Montevideo Rd
- 6506 Purplefinch Ct
- 5769 Montevideo Rd
- 6360 Thrasher Loop
- 1019 Swanton Ct
- 1015 Swanton Ct
- 4432 Scissortail Loop
- 806 Watten Ln
- 6874 Flatlands Rd
- 6352 Hibiscus Ct
- 640 Brook Run Dr
- 6006 Carnation Dr
- 3627 Manila Dr
- 6255 Carthage Dr
- 800 S Spring Rd
- 3596 Manila Dr
- 5660 Buenos Aires Blvd
- 810 Applewood Ln
- 1017 Newfields Ln
- 6412 Angelica Way
- 1280 Spring Brook Ct Unit 1280
- 1276 Spring Brook Ct
- 1282 Spring Brook Ct
- 1274 Spring Brook Ct
- 1284 Spring Brook Ct
- 1270 Spring Brook Ct
- 1288 Spring Brook Ct
- 1268 Spring Brook Ct
- 1290 Spring Brook Ct
- 1290 Spring Brook Ct Unit 13-129
- 1266 Spring Brook Ct
- 1292 Spring Brook Ct
- 1292 Spring Brook Ct Unit 13-129
- 1292 Spring Brook Ct Unit 3-1292
- 1279 Spring Brook Ct
- 1277 Spring Brook Ct
- 1264 Spring Brook Ct Unit 1264
- 1275 Spring Brook Ct
- 1294 Spring Brook Ct Unit 1294
- 1273 Spring Brook Ct Unit 1273