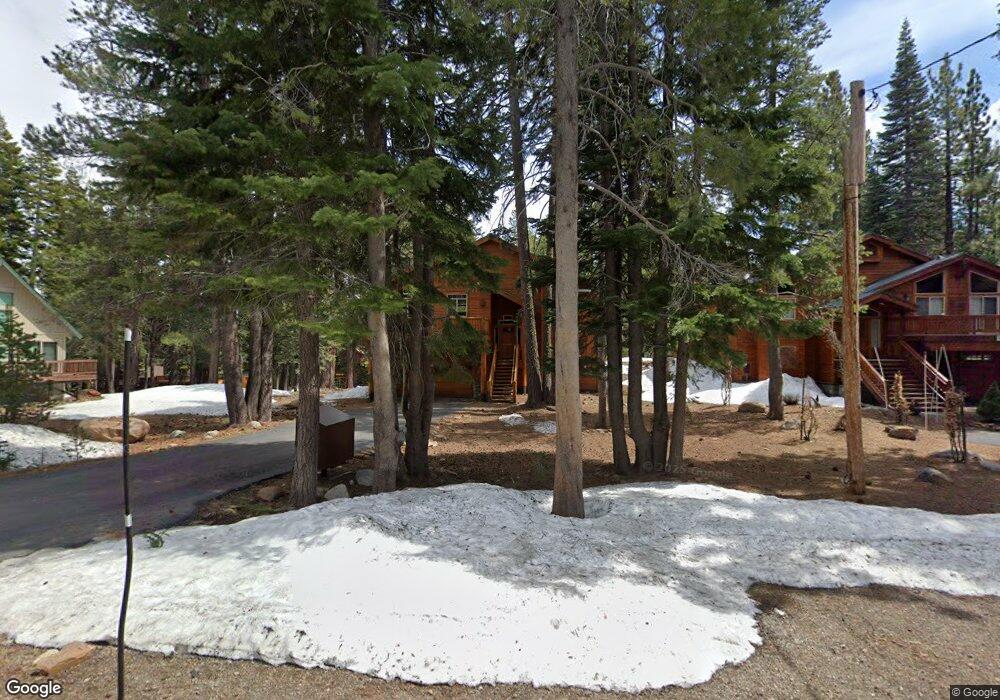
12783 Ski View Loop Truckee, CA 96161
Tahoe Donner NeighborhoodEstimated Value: $1,470,000 - $1,598,000
3
Beds
3
Baths
2,597
Sq Ft
$585/Sq Ft
Est. Value
About This Home
This home is located at 12783 Ski View Loop, Truckee, CA 96161 and is currently estimated at $1,519,377, approximately $585 per square foot. 12783 Ski View Loop is a home located in Nevada County with nearby schools including Truckee Elementary School, Alder Creek Middle School, and Tahoe Truckee High School.
Ownership History
Date
Name
Owned For
Owner Type
Purchase Details
Closed on
Jun 5, 2013
Sold by
Whitmore Christopher K and Whitmore Melinda J
Bought by
Whitmore Christopher K and Whitmore Melinda J
Current Estimated Value
Home Financials for this Owner
Home Financials are based on the most recent Mortgage that was taken out on this home.
Original Mortgage
$400,000
Outstanding Balance
$274,966
Interest Rate
2.75%
Mortgage Type
New Conventional
Estimated Equity
$1,244,411
Purchase Details
Closed on
Aug 18, 2011
Sold by
Whitmore Christopher K and Whitmore Melinda J
Bought by
Whitmore Christopher Kinney and Whitmore Melinda Joy
Home Financials for this Owner
Home Financials are based on the most recent Mortgage that was taken out on this home.
Original Mortgage
$414,000
Interest Rate
2.75%
Mortgage Type
New Conventional
Purchase Details
Closed on
Apr 12, 2011
Sold by
Whitmore Christopher K and Whitmore Melinda
Bought by
Whitmore Christopher Kinney and Whitmore Melinda Joy
Purchase Details
Closed on
Jun 21, 2007
Sold by
Whitmore Christopher K and Whitmore Melinda J
Bought by
Whitmore Christopher Kinney and Whitmore Melinda Joy
Home Financials for this Owner
Home Financials are based on the most recent Mortgage that was taken out on this home.
Original Mortgage
$600,000
Interest Rate
6.16%
Mortgage Type
Purchase Money Mortgage
Purchase Details
Closed on
Jun 1, 2007
Sold by
Johnston Patrick and Johnston Denise Roy
Bought by
Whitmore Christopher K and Whitmore Melinda J
Home Financials for this Owner
Home Financials are based on the most recent Mortgage that was taken out on this home.
Original Mortgage
$600,000
Interest Rate
6.16%
Mortgage Type
Purchase Money Mortgage
Purchase Details
Closed on
Dec 27, 2004
Sold by
Johnston Patrick and Johnston Denise Roy
Bought by
Johnston Patrick and Johnston Denise Roy
Purchase Details
Closed on
Dec 5, 2000
Sold by
M C Taylor Construction Inc
Bought by
Pdjm Enterprises Llc
Purchase Details
Closed on
Sep 22, 1999
Sold by
Ligouri James A and Weatherwax Jon T
Bought by
M C Taylor Construction Inc
Purchase Details
Closed on
Jul 22, 1999
Sold by
Prater Diane
Bought by
Chesler James Allan and Chesler Diane M
Create a Home Valuation Report for This Property
The Home Valuation Report is an in-depth analysis detailing your home's value as well as a comparison with similar homes in the area
Home Values in the Area
Average Home Value in this Area
Purchase History
| Date | Buyer | Sale Price | Title Company |
|---|---|---|---|
| Whitmore Christopher K | -- | Stewart Title Of California | |
| Whitmore Christopher Kinney | -- | First American Title Co | |
| Whitmore Christopher K | -- | First American Title Company | |
| Whitmore Christopher Kinney | -- | Stewart Title Of California | |
| Whitmore Christopher K | -- | Stewart Title Of California | |
| Whitmore Christopher Kinney | -- | None Available | |
| Whitmore Christopher K | $870,000 | Fidelity Natl Title Co Of Ca | |
| Johnston Patrick | -- | -- | |
| Johnston Patrick | -- | -- | |
| Pdjm Enterprises Llc | $650,000 | Placer Title Company | |
| M C Taylor Construction Inc | $65,000 | Placer Title Company | |
| Chesler James Allan | -- | -- | |
| Prater Diane | $15,000 | North American Title Co |
Source: Public Records
Mortgage History
| Date | Status | Borrower | Loan Amount |
|---|---|---|---|
| Open | Whitmore Christopher K | $400,000 | |
| Closed | Whitmore Christopher K | $414,000 | |
| Closed | Whitmore Christopher K | $600,000 |
Source: Public Records
Tax History
| Year | Tax Paid | Tax Assessment Tax Assessment Total Assessment is a certain percentage of the fair market value that is determined by local assessors to be the total taxable value of land and additions on the property. | Land | Improvement |
|---|---|---|---|---|
| 2025 | $13,627 | $1,150,499 | $402,904 | $747,595 |
| 2024 | $13,539 | $1,127,941 | $395,004 | $732,937 |
| 2023 | $13,539 | $1,105,825 | $387,259 | $718,566 |
| 2022 | $13,219 | $1,084,143 | $379,666 | $704,477 |
| 2021 | $12,701 | $1,062,827 | $372,163 | $690,664 |
| 2020 | $11,715 | $967,500 | $149,400 | $818,100 |
| 2019 | $11,745 | $948,600 | $146,500 | $802,100 |
| 2018 | $11,022 | $930,000 | $143,660 | $786,340 |
| 2017 | $11,005 | $930,000 | $317,000 | $613,000 |
| 2016 | $10,646 | $886,000 | $302,000 | $584,000 |
| 2015 | $10,360 | $869,000 | $296,000 | $573,000 |
| 2014 | $9,354 | $798,000 | $272,000 | $526,000 |
Source: Public Records
Map
Nearby Homes
- 13938 Northwoods Blvd
- 13854 Northwoods Blvd
- 14258 Glacier View Dr
- 13420 Northwoods Blvd
- 14579 Northwoods Blvd
- 14653 Northwoods Blvd
- 13239 Northwoods Blvd Unit B
- 13205 Northwoods Blvd Unit 2
- 12574 Saint Moritz Ln
- 16725 Ski Slope Way Unit 5
- 11926 Rhineland Ave
- 12621 Peregrine Dr
- 11711 Snowpeak Way Unit 555
- 13257 Ski Slope Way
- 11723 Snowpeak Way Unit 567
- 11591 Snowpeak Way Unit 407
- 13038 Ski Slope Way
- 14487 Ski Slope Way
- 15407 Wolfgang Rd
- 12465 Bear Meadows Ct Unit 3
- 12797 Ski View Loop Unit 11
- 12797 Ski View Loop
- 12765 Ski View Loop
- 12811 Ski View Loop
- 12755 Ski View Loop
- 14420 Tyrol Rd
- 12823 Ski View Loop
- 14450 Tyrol Rd
- 12784 Skiview Loop
- 12745 Ski View Loop
- 14394 Tyrol Rd
- 14464 Tyrol Rd
- 12812 Ski View Loop
- 12837 Ski View Loop
- 12755 Ski View
- 14478 Tyrol Rd
- 14384 Tyrol Rd
- 12756 Ski View Loop
- 12735 Ski View Loop
- 12824 Ski View Loop Unit 11
Your Personal Tour Guide
Ask me questions while you tour the home.