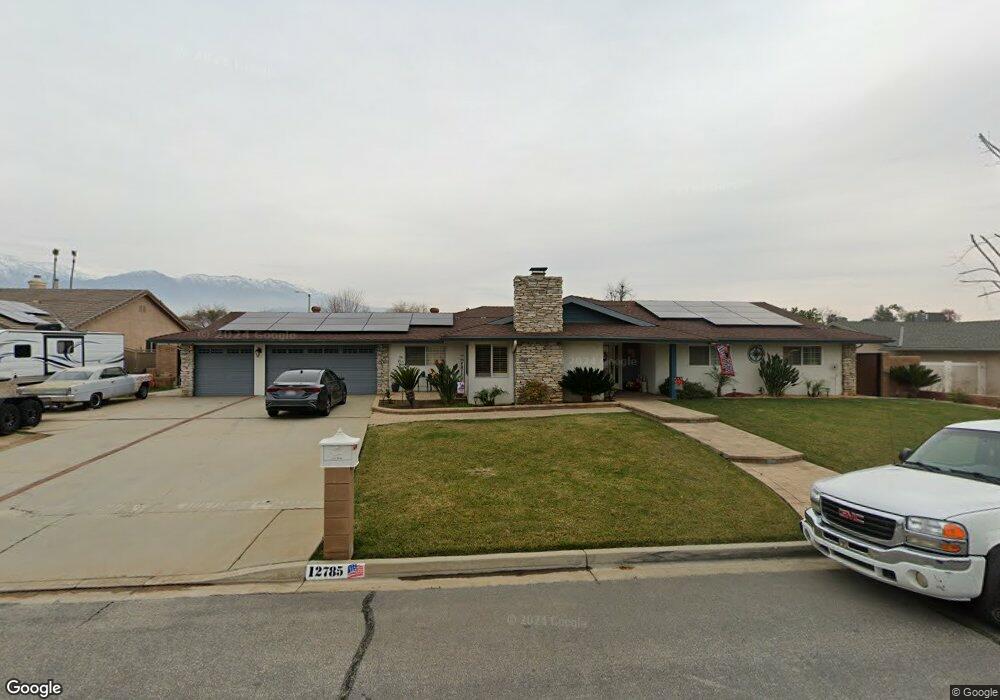
12785 Columbia Ave Yucaipa, CA 92399
Estimated Value: $659,000 - $743,000
4
Beds
2
Baths
2,173
Sq Ft
$316/Sq Ft
Est. Value
About This Home
This home is located at 12785 Columbia Ave, Yucaipa, CA 92399 and is currently estimated at $687,314, approximately $316 per square foot. 12785 Columbia Ave is a home located in San Bernardino County with nearby schools including Valley Elementary School, Park View Middle School, and Yucaipa High School.
Ownership History
Date
Name
Owned For
Owner Type
Purchase Details
Closed on
Oct 30, 2007
Sold by
Gebing Richard
Bought by
Gebing Jennifer
Current Estimated Value
Home Financials for this Owner
Home Financials are based on the most recent Mortgage that was taken out on this home.
Original Mortgage
$390,000
Outstanding Balance
$245,608
Interest Rate
6.29%
Mortgage Type
New Conventional
Estimated Equity
$441,706
Purchase Details
Closed on
Dec 6, 2002
Sold by
Whithouse Claudia
Bought by
Gebing Richard and Gebing Jennifer
Home Financials for this Owner
Home Financials are based on the most recent Mortgage that was taken out on this home.
Original Mortgage
$220,500
Interest Rate
6.03%
Purchase Details
Closed on
Dec 13, 1999
Sold by
Braun Robert A
Bought by
Braun Robert A and Robert A Braun Trust Of 1999
Create a Home Valuation Report for This Property
The Home Valuation Report is an in-depth analysis detailing your home's value as well as a comparison with similar homes in the area
Home Values in the Area
Average Home Value in this Area
Purchase History
We collect this data history from publicly available records. To have your information removed, we recommend requesting removal directly through your county’s website.
| Date | Buyer | Sale Price | Title Company |
|---|---|---|---|
| Gebing Jennifer | -- | Security Union Title Company | |
| Gebing Richard | $245,000 | Chicago Title Co | |
| Braun Robert A | -- | -- |
Source: Public Records
Mortgage History
We collect this data history from publicly available records. To have your information removed, we recommend requesting removal directly through your county’s website.
| Date | Status | Borrower | Loan Amount |
|---|---|---|---|
| Open | Gebing Jennifer | $390,000 | |
| Closed | Gebing Richard | $220,500 |
Source: Public Records
Tax History
| Year | Tax Paid | Tax Assessment Tax Assessment Total Assessment is a certain percentage of the fair market value that is determined by local assessors to be the total taxable value of land and additions on the property. | Land | Improvement |
|---|---|---|---|---|
| 2025 | $5,356 | $412,217 | $88,709 | $323,508 |
| 2024 | $5,200 | $404,135 | $86,970 | $317,165 |
| 2023 | $5,090 | $396,211 | $85,265 | $310,946 |
| 2022 | $5,015 | $388,442 | $83,593 | $304,849 |
| 2021 | $4,934 | $380,826 | $81,954 | $298,872 |
| 2020 | $4,968 | $376,921 | $81,114 | $295,807 |
| 2019 | $4,820 | $369,531 | $79,524 | $290,007 |
| 2018 | $4,381 | $362,286 | $77,965 | $284,321 |
| 2017 | $4,047 | $335,186 | $76,437 | $258,749 |
| 2016 | $3,993 | $328,613 | $74,938 | $253,675 |
| 2015 | $3,951 | $323,677 | $73,812 | $249,865 |
| 2014 | $3,687 | $302,000 | $91,000 | $211,000 |
Source: Public Records
Map
Nearby Homes
- 33763 Noreen Ln
- 33817 Liberty Rd
- 33538 Colorado St
- 12598 6th St
- 12749 Via Barcelona Rd
- 33460 Brushy Hollow Dr
- 13170 6th Place
- 12995 6th St Unit 71
- 12995 6th St Unit 66
- 12839 10th St
- 33136 Colorado St
- 12449 6th St
- 12896 Emerald Bay Ct
- 33600 Calimesa Blvd Unit 155
- 33288 Colorado St
- 34111 Wildwood Canyon Rd Unit 2
- 34111 Wildwood Canyon Rd Unit 138
- 12946 5th St
- 33848 Avenue G
- 33942 Telstar Rd
- 12769 Columbia Ave
- 12799 Columbia Ave
- 33803 Woody Ln
- 12757 Columbia Ave
- 33815 Woody Ln
- 12766 Columbia Ave
- 12819 Columbia Ave
- 33812 Woody Ln
- 33827 Woody Ln
- 12808 Cypress St
- 12758 Columbia Ave
- 12780 Columbia Ave
- 12794 Columbia Ave
- 33787 Fairview Dr
- 33777 Fairview Dr
- 12818 Columbia Ave
- 33824 Woody Ln
- 33775 Fairview Dr
- 33839 Woody Ln
- 33805 Fairview Dr
Your Personal Tour Guide
Ask me questions while you tour the home.