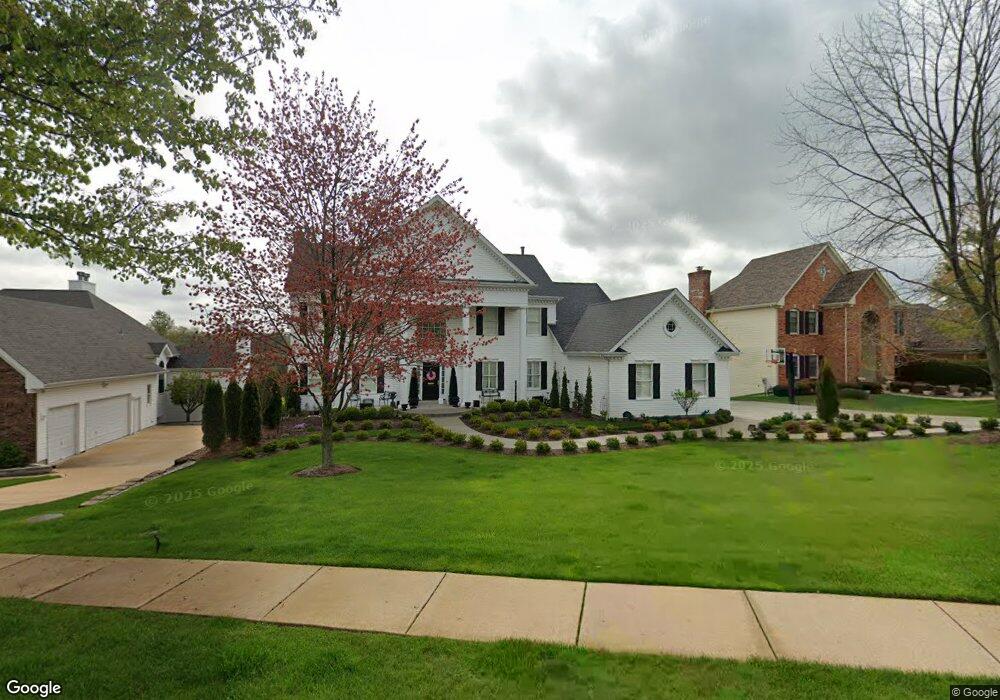
12786 Wynfield Pines Ct Saint Louis, MO 63131
Estimated Value: $1,055,434 - $1,131,000
4
Beds
5
Baths
4,694
Sq Ft
$232/Sq Ft
Est. Value
About This Home
This home is located at 12786 Wynfield Pines Ct, Saint Louis, MO 63131 and is currently estimated at $1,087,109, approximately $231 per square foot. 12786 Wynfield Pines Ct is a home located in St. Louis County with nearby schools including Westchester Elementary School, North Kirkwood Middle School, and Kirkwood Senior High School.
Ownership History
Date
Name
Owned For
Owner Type
Purchase Details
Closed on
Jun 5, 2025
Sold by
Litteken Jeffrey A and Litteken Laura I
Bought by
Litteken Laura I and Litteken Jeffrey A
Current Estimated Value
Purchase Details
Closed on
Mar 29, 2017
Sold by
Litteken Carol D
Bought by
Litteken Jeffrey and Litteken Laura
Purchase Details
Closed on
Aug 8, 2005
Sold by
Litteken Jeffrey and Litteken Carol D
Bought by
Litteken Jeffrey and Litteken Laura
Purchase Details
Closed on
Jun 11, 2003
Sold by
Litteken Jeffrey and Jones Mitzi
Bought by
Litteken Jeffrey and Litteken Carol D
Purchase Details
Closed on
Aug 8, 2001
Sold by
Dushan Manjencich
Bought by
Litteken Jeffrey and Jones Mitzi
Purchase Details
Closed on
Dec 30, 1999
Sold by
Barry Simon Group Co
Bought by
Manjencich Dushan and Manjencich Zora
Create a Home Valuation Report for This Property
The Home Valuation Report is an in-depth analysis detailing your home's value as well as a comparison with similar homes in the area
Home Values in the Area
Average Home Value in this Area
Purchase History
| Date | Buyer | Sale Price | Title Company |
|---|---|---|---|
| Litteken Laura I | -- | None Listed On Document | |
| Litteken Jeffrey | -- | None Available | |
| Litteken Jeffrey | -- | -- | |
| Litteken Jeffrey | -- | -- | |
| Litteken Jeffrey | $640,000 | -- | |
| Litteken Jeffrey | $640,000 | -- | |
| Manjencich Dushan | $605,200 | -- |
Source: Public Records
Tax History Compared to Growth
Tax History
| Year | Tax Paid | Tax Assessment Tax Assessment Total Assessment is a certain percentage of the fair market value that is determined by local assessors to be the total taxable value of land and additions on the property. | Land | Improvement |
|---|---|---|---|---|
| 2025 | $9,942 | $201,190 | $52,210 | $148,980 |
| 2024 | $9,942 | $172,790 | $30,460 | $142,330 |
| 2023 | $9,942 | $172,790 | $30,460 | $142,330 |
| 2022 | $8,244 | $135,570 | $39,160 | $96,410 |
| 2021 | $8,154 | $135,570 | $39,160 | $96,410 |
| 2020 | $9,202 | $147,140 | $34,810 | $112,330 |
| 2019 | $8,038 | $127,850 | $34,810 | $93,040 |
| 2018 | $7,337 | $104,690 | $27,610 | $77,080 |
| 2017 | $7,357 | $104,690 | $27,610 | $77,080 |
| 2016 | $6,750 | $97,260 | $23,810 | $73,450 |
| 2015 | $6,730 | $97,260 | $23,810 | $73,450 |
| 2014 | $7,408 | $104,690 | $33,210 | $71,480 |
Source: Public Records
Map
Nearby Homes
- 12213 Brook Springs Ct
- 2145 Trailcrest Dr
- 2037 Trailcrest Ln Unit 7
- 698 Trailcrest Ct Unit 5
- 591-593 N Ballas Rd
- 2000 Trailcrest Ln Unit 3
- 2033 Woodland Knoll
- 2025 Woodland Knoll
- 2005 Woodland Knoll
- 12224 TBB Roger Ln
- 2002 Woodland Knoll
- 918 N Ballas Rd
- 2300 E Royal Ct
- 12819 Huntercreek Rd
- 467 Tree Top Ln
- 2211 Viewroyal Dr
- 2405 Fairoyal Dr
- 1710 Lynkirk Ln
- 9 Enclave Dr
- 12006 Montour Dr
- 12782 Wynfield Pines Ct
- 12790 Wynfield Pines Ct
- 12706 Wynfield Pines Ct
- 12778 Wynfield Pines Ct
- 12787 Wynfield Pines Ct
- 12794 Wynfield Pines Ct
- 12710 Wynfield Pines Ct
- 12718 Wynfield Pines Ct
- 12702 Wynfield Pines Ct
- 12779 Wynfield Pines Ct
- 12798 Wynfield Pines Ct
- 12774 Wynfield Pines Ct
- 12714 Wynfield Pines Ct
- 12775 Wynfield Pines Ct
- 12791 English Walnut Dr
- 12795 English Walnut Dr
- 12722 Wynfield Pines Ct
- 12787 English Walnut Dr
- 888 Des Peres Rd
- 12703 Wynfield Pines Ct