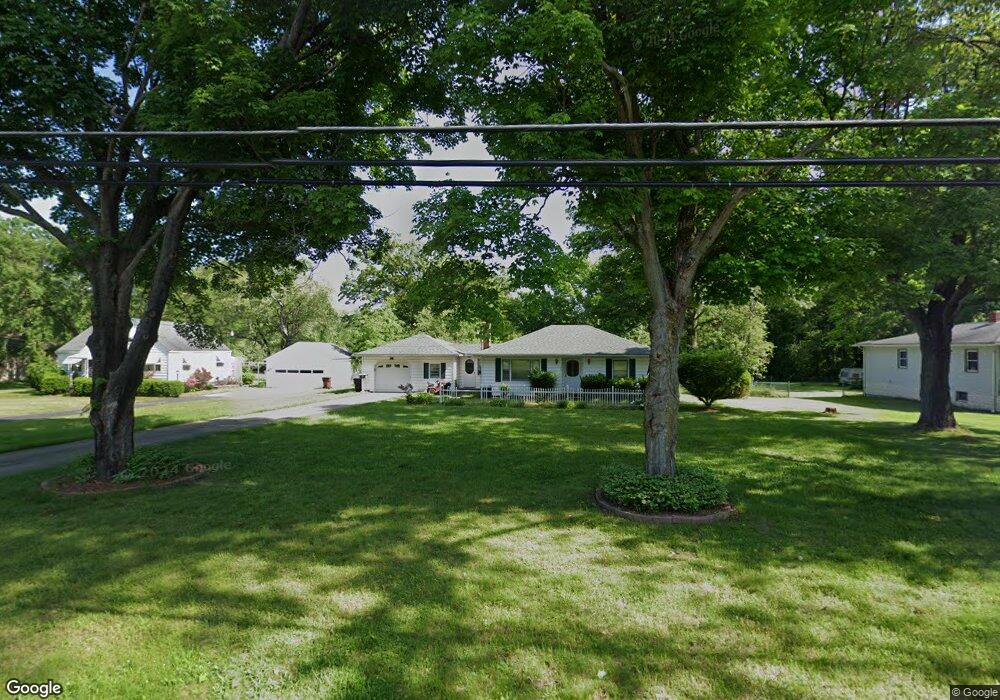
1279 Midland Ave New Franklin, OH 44203
Estimated Value: $179,000 - $238,000
2
Beds
1
Bath
1,098
Sq Ft
$185/Sq Ft
Est. Value
About This Home
This home is located at 1279 Midland Ave, New Franklin, OH 44203 and is currently estimated at $203,678, approximately $185 per square foot. 1279 Midland Ave is a home located in Summit County with nearby schools including Coventry Middle School, Coventry High School, and St. Francis de Sales School.
Ownership History
Date
Name
Owned For
Owner Type
Purchase Details
Closed on
Sep 20, 2005
Sold by
Lowe Gloria J
Bought by
Tauscher Robert W
Current Estimated Value
Home Financials for this Owner
Home Financials are based on the most recent Mortgage that was taken out on this home.
Original Mortgage
$120,000
Outstanding Balance
$64,844
Interest Rate
6.01%
Mortgage Type
Fannie Mae Freddie Mac
Estimated Equity
$138,834
Purchase Details
Closed on
Dec 22, 1997
Sold by
Bereschak George
Bought by
Lowe Arlie P and Lowe Gloria J
Home Financials for this Owner
Home Financials are based on the most recent Mortgage that was taken out on this home.
Original Mortgage
$72,000
Interest Rate
7.36%
Mortgage Type
New Conventional
Create a Home Valuation Report for This Property
The Home Valuation Report is an in-depth analysis detailing your home's value as well as a comparison with similar homes in the area
Home Values in the Area
Average Home Value in this Area
Purchase History
| Date | Buyer | Sale Price | Title Company |
|---|---|---|---|
| Tauscher Robert W | $130,000 | Falls Title Agency Inc | |
| Lowe Arlie P | $90,000 | -- |
Source: Public Records
Mortgage History
| Date | Status | Borrower | Loan Amount |
|---|---|---|---|
| Open | Tauscher Robert W | $120,000 | |
| Previous Owner | Lowe Arlie P | $72,000 |
Source: Public Records
Tax History Compared to Growth
Tax History
| Year | Tax Paid | Tax Assessment Tax Assessment Total Assessment is a certain percentage of the fair market value that is determined by local assessors to be the total taxable value of land and additions on the property. | Land | Improvement |
|---|---|---|---|---|
| 2025 | $3,152 | $62,619 | $17,868 | $44,751 |
| 2024 | $3,152 | $62,619 | $17,868 | $44,751 |
| 2023 | $3,152 | $62,619 | $17,868 | $44,751 |
| 2022 | $2,675 | $45,837 | $12,856 | $32,981 |
| 2021 | $2,715 | $45,837 | $12,856 | $32,981 |
| 2020 | $2,604 | $45,840 | $12,860 | $32,980 |
| 2019 | $2,378 | $38,550 | $8,640 | $29,910 |
| 2018 | $2,352 | $38,550 | $8,640 | $29,910 |
| 2017 | $2,183 | $38,550 | $8,640 | $29,910 |
| 2016 | $2,152 | $32,900 | $8,640 | $24,260 |
| 2015 | $2,183 | $32,900 | $8,640 | $24,260 |
| 2014 | $2,188 | $32,900 | $8,640 | $24,260 |
| 2013 | $2,633 | $40,220 | $8,640 | $31,580 |
Source: Public Records
Map
Nearby Homes
- 1343 Vermillion Dr
- 4393 Hilltop Dr
- 4134 Lake Vista Rd
- 1365 Vanderhoof Rd
- 1742 Turkeyfoot Lake Rd
- 4973 Patricia Dr
- 4034 Manchester Rd
- 4216 State Rd
- 0 W Turkeyfoot Lake Rd Unit 5157637
- 4577 Rex Lake Dr
- 855 Fowler Ave
- 3826 Powell Ave
- 3739 Bower Ave
- 834 State Mill Rd
- 809 Zeletta Dr
- 547 Kruger Ave
- 3970 Melton Ave
- 3738 Random Dr
- 369 Big Bend Cir
- 870 Sail Dr
- 1299 Midland Ave
- 1259 Midland Ave
- 1269 Midland Ave
- 1288 Midland Ave
- 1289 Midland Ave
- 1278 Midland Ave
- 1249 Midland Ave
- 1296 Midland Ave
- 1309 Midland Ave
- 1270 Midland Ave
- 1306 Midland Ave
- 1260 Midland Ave
- 1314 Midland Ave
- 1239 Midland Ave
- 1252 Midland Ave
- 1322 Midland Ave
- 1242 Midland Ave
- 1339 Midland Ave
- 1332 Midland Ave
- 1229 Midland Ave