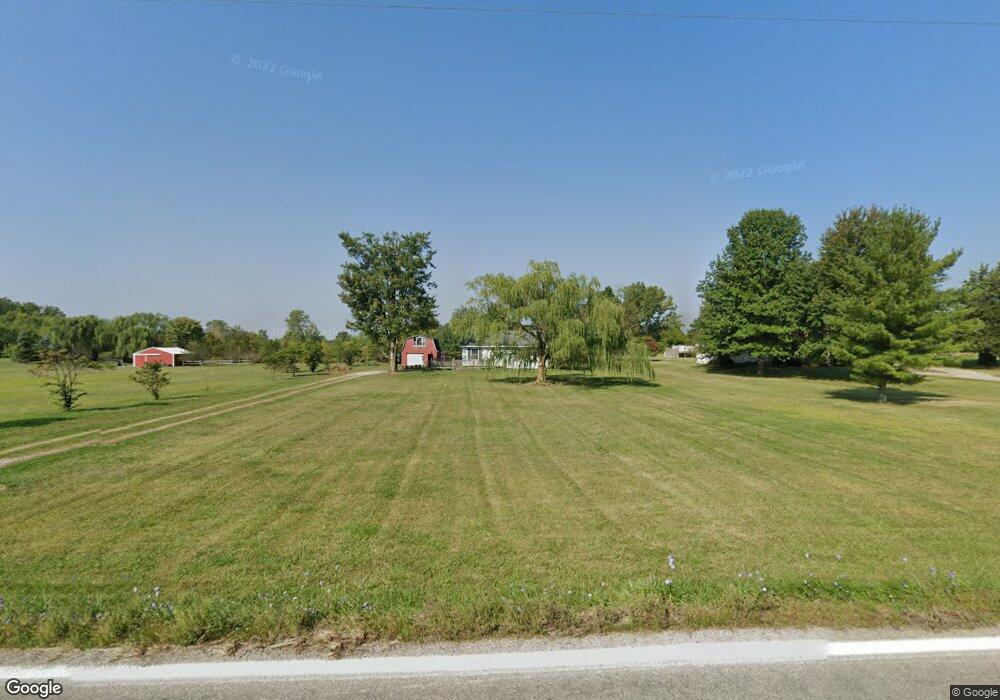
1279 Prospect Upper Sandusky Rd N Marion, OH 43302
Estimated Value: $139,000 - $209,359
3
Beds
1
Bath
952
Sq Ft
$187/Sq Ft
Est. Value
About This Home
This home is located at 1279 Prospect Upper Sandusky Rd N, Marion, OH 43302 and is currently estimated at $177,840, approximately $186 per square foot. 1279 Prospect Upper Sandusky Rd N is a home located in Marion County with nearby schools including Ridgedale Elementary School and Ridgedale Junior/Senior High School.
Ownership History
Date
Name
Owned For
Owner Type
Purchase Details
Closed on
Feb 22, 2021
Sold by
Jennings Family Investments Llc
Bought by
Large Matthew B
Current Estimated Value
Home Financials for this Owner
Home Financials are based on the most recent Mortgage that was taken out on this home.
Original Mortgage
$74,907
Outstanding Balance
$66,996
Interest Rate
2.7%
Mortgage Type
New Conventional
Estimated Equity
$110,844
Purchase Details
Closed on
Dec 15, 2016
Sold by
Secretary Of Hud
Bought by
Jennings Family Investments Llc
Purchase Details
Closed on
Jan 11, 2016
Sold by
Wells Fargo Bank Na
Bought by
Secretary Of Housing & Urban Development
Purchase Details
Closed on
Nov 13, 2015
Sold by
Newcombe Ann
Bought by
Wells Fargo Bank Na
Purchase Details
Closed on
Jul 4, 2005
Sold by
Amlin Roseann
Bought by
Newcombe Ann
Home Financials for this Owner
Home Financials are based on the most recent Mortgage that was taken out on this home.
Original Mortgage
$92,866
Interest Rate
5.98%
Mortgage Type
FHA
Purchase Details
Closed on
May 28, 1997
Bought by
Hud Secretary Of
Create a Home Valuation Report for This Property
The Home Valuation Report is an in-depth analysis detailing your home's value as well as a comparison with similar homes in the area
Home Values in the Area
Average Home Value in this Area
Purchase History
| Date | Buyer | Sale Price | Title Company |
|---|---|---|---|
| Large Matthew B | $78,900 | None Available | |
| Jennings Family Investments Llc | -- | None Available | |
| Secretary Of Housing & Urban Development | -- | Attorney | |
| Wells Fargo Bank Na | $33,334 | Attorney | |
| Newcombe Ann | $92,900 | None Available | |
| Hud Secretary Of | $77,400 | -- |
Source: Public Records
Mortgage History
| Date | Status | Borrower | Loan Amount |
|---|---|---|---|
| Open | Large Matthew B | $74,907 | |
| Previous Owner | Newcombe Ann | $92,866 |
Source: Public Records
Tax History Compared to Growth
Tax History
| Year | Tax Paid | Tax Assessment Tax Assessment Total Assessment is a certain percentage of the fair market value that is determined by local assessors to be the total taxable value of land and additions on the property. | Land | Improvement |
|---|---|---|---|---|
| 2024 | $1,529 | $45,070 | $9,820 | $35,250 |
| 2023 | $1,529 | $45,070 | $9,820 | $35,250 |
| 2022 | $1,306 | $38,600 | $9,820 | $28,780 |
| 2021 | $1,098 | $28,770 | $8,720 | $20,050 |
| 2020 | $1,054 | $28,770 | $8,720 | $20,050 |
| 2019 | $1,052 | $28,770 | $8,720 | $20,050 |
| 2018 | $879 | $26,010 | $7,060 | $18,950 |
| 2017 | $837 | $26,010 | $7,060 | $18,950 |
| 2016 | $831 | $26,010 | $7,060 | $18,950 |
| 2015 | $509 | $24,860 | $6,300 | $18,560 |
| 2014 | $511 | $24,860 | $6,300 | $18,560 |
| 2012 | $572 | $25,930 | $5,470 | $20,460 |
Source: Public Records
Map
Nearby Homes
- 3217 Harding Hwy W
- 1890 Bumford Rd
- 2109 Harding Hwy W
- 383 Brentwood Dr
- 355 Lee St
- 523 Thompson St
- 3422 Hillman Ford Rd
- 434 Scranton Ave
- 472 Clinton St
- 690 Meadow St
- 531 Toledo Ave
- 641 Blake Ave
- 678 Marshall St
- 520 Toledo Ave
- 407 Latourette St
- 473 Avondale Ave
- 468 Avondale Ave
- 213 Sharp St
- 950 Oak Grove Ave
- 403 Uncapher Ave
- 1279 Prospect-Upper Sandusky Rd N
- 1279 Prospect Upper Sandusky Rd N
- 1295 Prosp Upper Sand Rd N
- 1317 Prospect Upper Sandusky Rd N
- 1317 Prospect-Upper Sandusky Rd N
- 1284 Prosp Upper Sand Rd N
- 1284 Prospect Upper Sandusky Rd N
- 1331 Prospect Upper Sandusky Rd N
- 1227 Prospect Upper Sandusky Rd N
- 1310 Prosp Upper Sand Rd N
- 1212 Prosp Upper Sand Rd N
- 1336 Prosp Upper Sand Rd N
- 1345 Prosp Upper Sand Rd N
- 1203 Prospect Upper Sandusky Rd N
- 1203 Prospect-Upper Sandusky Rd N
- 1350 Prospect Upper Sandusky Rd N
- 1350 Prospect-Upper Sandusky Rd N
- 1350 Prosp Upper Sand Rd N
- 1367 Prosp Upper Sand Rd N
- 2336 Decliff-Big Island Rd