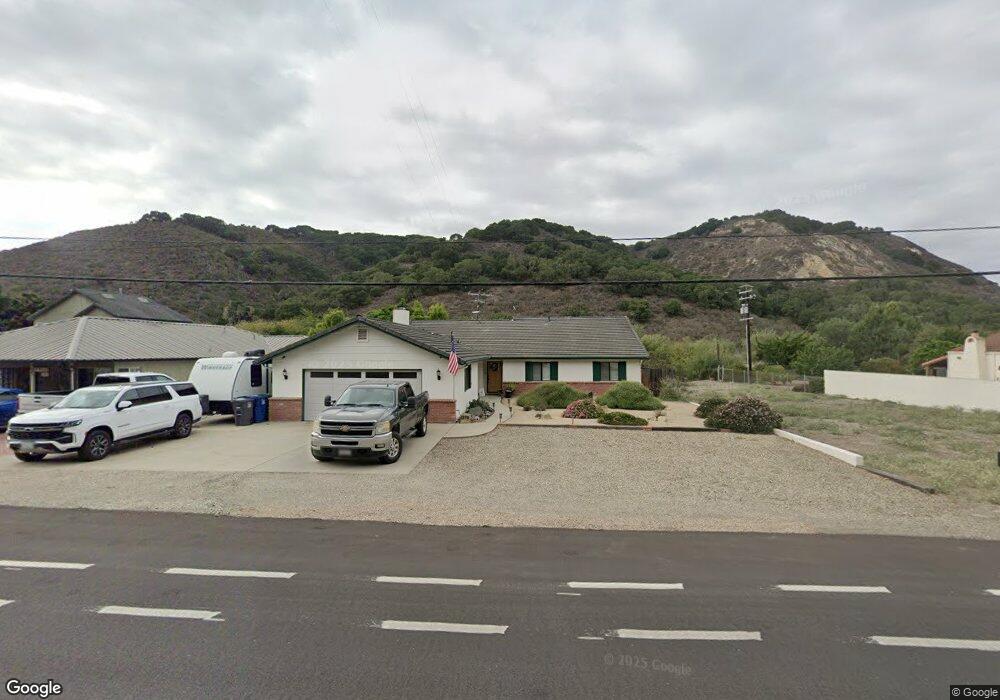
1279 San Miguelito Rd Lompoc, CA 93436
Estimated Value: $659,000 - $902,000
4
Beds
3
Baths
2,073
Sq Ft
$362/Sq Ft
Est. Value
About This Home
This home is located at 1279 San Miguelito Rd, Lompoc, CA 93436 and is currently estimated at $750,117, approximately $361 per square foot. 1279 San Miguelito Rd is a home located in Santa Barbara County with nearby schools including Arthur Hapgood Elementary School, Lompoc Valley Middle School, and Lompoc High School.
Ownership History
Date
Name
Owned For
Owner Type
Purchase Details
Closed on
Oct 26, 2020
Sold by
Johnson Thomas S and Johnson Victoria M
Bought by
Johnson Thomas S and Johnson Victoria M
Current Estimated Value
Home Financials for this Owner
Home Financials are based on the most recent Mortgage that was taken out on this home.
Original Mortgage
$200,000
Outstanding Balance
$162,028
Interest Rate
3%
Mortgage Type
New Conventional
Estimated Equity
$588,089
Purchase Details
Closed on
Jun 27, 2019
Sold by
Johnson Thomas S and Martinez Johnson Victoria
Bought by
Johnson Thomas S and Johnson Victoria M
Purchase Details
Closed on
Mar 2, 2011
Sold by
Johnson Thomas S and Martinez Johnson Victoria
Bought by
Anderson Louisa C and Louisa Anderson Trust
Create a Home Valuation Report for This Property
The Home Valuation Report is an in-depth analysis detailing your home's value as well as a comparison with similar homes in the area
Home Values in the Area
Average Home Value in this Area
Purchase History
| Date | Buyer | Sale Price | Title Company |
|---|---|---|---|
| Johnson Thomas S | -- | Amrock Inc | |
| Johnson Thomas S | -- | Amrock Inc | |
| Johnson Thomas S | -- | None Available | |
| Anderson Louisa C | -- | None Available |
Source: Public Records
Mortgage History
| Date | Status | Borrower | Loan Amount |
|---|---|---|---|
| Open | Johnson Thomas S | $200,000 |
Source: Public Records
Tax History
| Year | Tax Paid | Tax Assessment Tax Assessment Total Assessment is a certain percentage of the fair market value that is determined by local assessors to be the total taxable value of land and additions on the property. | Land | Improvement |
|---|---|---|---|---|
| 2025 | $3,692 | $348,927 | $101,134 | $247,793 |
| 2023 | $3,692 | $335,379 | $97,207 | $238,172 |
| 2022 | $3,627 | $328,803 | $95,301 | $233,502 |
| 2021 | $3,668 | $322,357 | $93,433 | $228,924 |
| 2020 | $3,627 | $319,052 | $92,475 | $226,577 |
| 2019 | $3,567 | $312,797 | $90,662 | $222,135 |
| 2018 | $3,511 | $306,665 | $88,885 | $217,780 |
| 2017 | $3,446 | $300,653 | $87,143 | $213,510 |
| 2016 | $3,383 | $294,759 | $85,435 | $209,324 |
| 2014 | $3,308 | $284,646 | $82,504 | $202,142 |
Source: Public Records
Map
Nearby Homes
- 1401 San Miguelito Rd
- 616 University Dr
- 413 S O Place
- 1328 W Willow Ave
- 215 S H St
- 205 S E St
- 117 S I St
- 1105 E Olive Ave
- 1311 W Cypress Ave Unit B2
- 127 N E St
- 524 Avalon St
- 400 Coronado Dr
- 217 N M St
- 23 Village Circle Dr
- 109 S 3rd St
- 1200 Peach Ave
- 1410 W Apricot Ave
- 1011 W Walnut Ave
- 230 N R St
- 267 Village Circle Dr
- 1281 San Miguelito Rd
- 1301 San Miguelito Rd
- 1273 San Miguelito Rd
- 1325 San Miguelito Rd
- 1271 San Miguelito Rd
- 1335 San Miguelito Rd
- 1345 San Miguelito Rd
- 1259 San Miguelito Rd
- 1259 San Miguelito 1weup77ogzas
- 1355 San Miguelito Rd
- 1365 San Miguelito Rd
- 1375 San Miguelito Rd
- 0 San Miguelito Unit 27024
- 0 San Miguelito Unit 27023
- 0 San Miguelito Unit 167772
- 0 San Miguelito Unit 167647
- 0 San Miguelito Unit 157080
- 0 San Miguelito Unit 987533
- 0 San Miguelito Unit 181934
- 0 San Miguelito Unit 181932
Your Personal Tour Guide
Ask me questions while you tour the home.