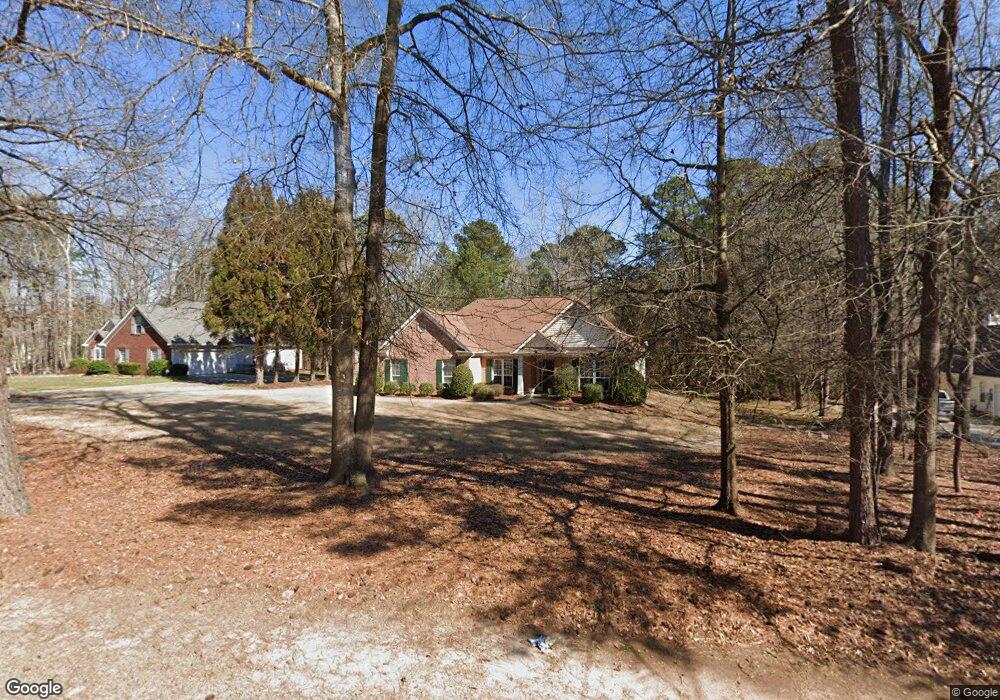
12796 Panhandle Rd Hampton, GA 30228
Estimated Value: $285,133 - $344,000
3
Beds
2
Baths
1,816
Sq Ft
$167/Sq Ft
Est. Value
About This Home
This home is located at 12796 Panhandle Rd, Hampton, GA 30228 and is currently estimated at $304,033, approximately $167 per square foot. 12796 Panhandle Rd is a home located in Clayton County with nearby schools including River's Edge Elementary School, Eddie White Academy, and Lovejoy High School.
Ownership History
Date
Name
Owned For
Owner Type
Purchase Details
Closed on
Aug 17, 2016
Sold by
Teresa D
Bought by
Brown Emmett J
Current Estimated Value
Purchase Details
Closed on
Dec 30, 2005
Sold by
Ellis Charlie T and Ellis Tony L
Bought by
Brown Emmett and Brown Teresa
Home Financials for this Owner
Home Financials are based on the most recent Mortgage that was taken out on this home.
Original Mortgage
$134,000
Interest Rate
6.9%
Mortgage Type
New Conventional
Purchase Details
Closed on
Jul 29, 1998
Sold by
Beta Construction
Bought by
Ellis Charles T and Ellis Tonya L
Create a Home Valuation Report for This Property
The Home Valuation Report is an in-depth analysis detailing your home's value as well as a comparison with similar homes in the area
Home Values in the Area
Average Home Value in this Area
Purchase History
| Date | Buyer | Sale Price | Title Company |
|---|---|---|---|
| Brown Emmett J | $185,000 | -- | |
| Brown Emmett J | $185,000 | -- | |
| Brown Emmett | $167,500 | -- | |
| Brown Emmett | $167,500 | -- | |
| Ellis Charles T | $131,000 | -- | |
| Ellis Charles T | $131,000 | -- |
Source: Public Records
Mortgage History
| Date | Status | Borrower | Loan Amount |
|---|---|---|---|
| Previous Owner | Brown Emmett | $134,000 |
Source: Public Records
Tax History
| Year | Tax Paid | Tax Assessment Tax Assessment Total Assessment is a certain percentage of the fair market value that is determined by local assessors to be the total taxable value of land and additions on the property. | Land | Improvement |
|---|---|---|---|---|
| 2025 | $3,783 | $107,760 | $10,400 | $97,360 |
| 2024 | $4,021 | $112,080 | $10,400 | $101,680 |
| 2023 | $4,002 | $110,840 | $10,400 | $100,440 |
| 2022 | $3,314 | $93,440 | $10,400 | $83,040 |
| 2021 | $2,415 | $70,160 | $10,400 | $59,760 |
| 2020 | $2,273 | $65,848 | $10,400 | $55,448 |
| 2019 | $2,273 | $65,033 | $10,400 | $54,633 |
| 2018 | $2,157 | $62,169 | $10,400 | $51,769 |
| 2017 | $1,843 | $54,343 | $10,400 | $43,943 |
| 2016 | $1,501 | $45,942 | $10,400 | $35,542 |
| 2015 | $1,336 | $0 | $0 | $0 |
| 2014 | $1,250 | $40,437 | $10,400 | $30,037 |
Source: Public Records
Map
Nearby Homes
- 644 Hampton Rd
- 829 Sweden Forest Cove
- 0 Panhandle Rd Unit LOT 1 10559919
- 0 Panhandle Rd Unit LOT 4 10559933
- 0 Panhandle Rd Unit LOT 3 10559926
- 424 Hampton Rd
- 1083 Hampton Rd
- 12328 Edgewater Dr
- 12359 Hillcrest Dr
- 12275 Styron Dr
- 12283 Coldstream Ct
- 12148 Flannery Ln
- 526 Canady Ct
- 12237 Dickson Rd Unit 1
- 12123 Edgewater Dr
- 12140 Dominion Dr
- 12402 Muir Field Ct
- 11961 Markham Way
- 12095 Panhandle Rd
- 12090 Centerra Dr
- 12796 Panhandle Rd Unit 113
- 12784 Panhandle Rd
- 12808 Panhandle Rd
- 12797 Panhandle Rd
- 12805 Panhandle Rd
- 805 Lucas Dr
- 12789 Panhandle Rd
- 791 Lucas Dr
- 817 Lucas Dr
- 12781 Panhandle Rd
- 12824 Panhandle Rd
- 813 Holland Ct
- 12813 Panhandle Rd
- 814 Holland Ct
- 829 Lucas Dr
- 735 Country Lake Dr
- 12838 Panhandle Rd
- 12821 Panhandle Rd
- 804 Lucas Dr
- 817 Holland Ct
Your Personal Tour Guide
Ask me questions while you tour the home.