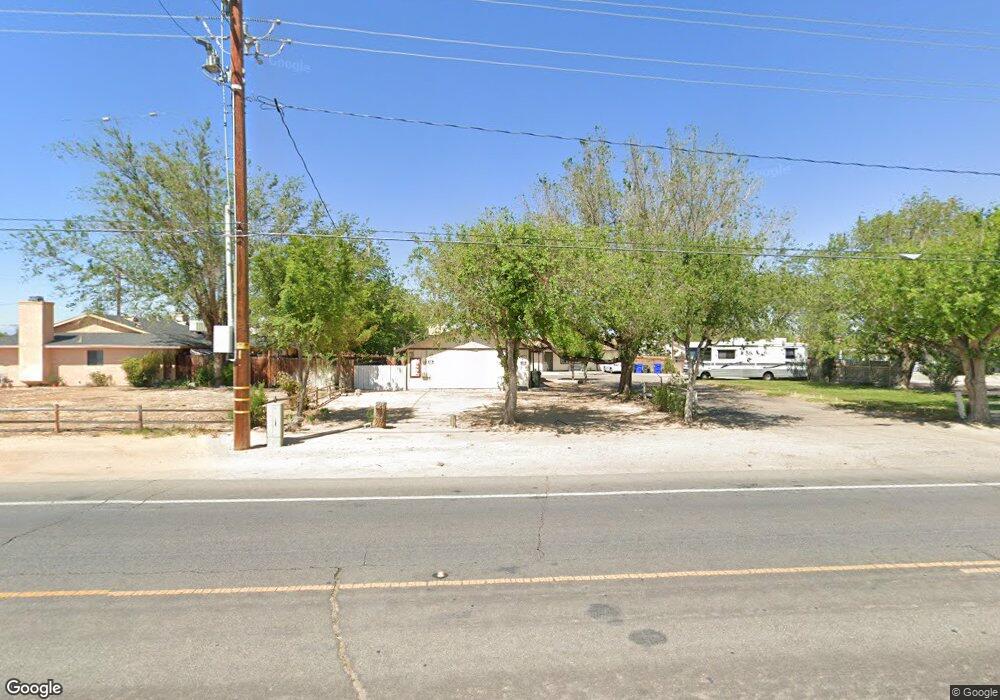
12798 Kiowa Rd Apple Valley, CA 92308
High Desert NeighborhoodEstimated Value: $510,000 - $567,000
Studio
4
Baths
2,400
Sq Ft
$225/Sq Ft
Est. Value
About This Home
This home is located at 12798 Kiowa Rd, Apple Valley, CA 92308 and is currently estimated at $540,667, approximately $225 per square foot. 12798 Kiowa Rd is a home located in San Bernardino County with nearby schools including Sitting Bull Academy and Apple Valley High School.
Ownership History
Date
Name
Owned For
Owner Type
Purchase Details
Closed on
Aug 12, 2024
Sold by
Stephens John Rory
Bought by
John R Stephens Family Trust and Stephens
Current Estimated Value
Purchase Details
Closed on
May 7, 1997
Sold by
Stephens John Rory
Bought by
Stephens John Rory and Stephens John Lee
Home Financials for this Owner
Home Financials are based on the most recent Mortgage that was taken out on this home.
Original Mortgage
$46,900
Interest Rate
8.13%
Purchase Details
Closed on
Oct 19, 1996
Sold by
First National Bank Of Chicago
Bought by
Stephens John Rory
Purchase Details
Closed on
May 24, 1996
Sold by
Leland Gerald J
Bought by
First National Bank Of Chicago and Rtc Mtg Pass Through Certificates Series
Purchase Details
Closed on
Feb 13, 1996
Sold by
Ownbey Jimmy W
Bought by
Boatmens National Mtg Inc
Purchase Details
Closed on
Sep 15, 1993
Sold by
Leland Gerald J
Bought by
Ownbey Jimmy W
Create a Home Valuation Report for This Property
The Home Valuation Report is an in-depth analysis detailing your home's value as well as a comparison with similar homes in the area
Home Values in the Area
Average Home Value in this Area
Purchase History
| Date | Buyer | Sale Price | Title Company |
|---|---|---|---|
| John R Stephens Family Trust | -- | None Listed On Document | |
| Stephens John Rory | -- | Commonwealth Land Title Co | |
| Stephens John Rory | $44,000 | Orange Coast Title | |
| First National Bank Of Chicago | $38,445 | First Southwestern Title Co | |
| Boatmens National Mtg Inc | -- | -- | |
| Ownbey Jimmy W | -- | -- |
Source: Public Records
Mortgage History
| Date | Status | Borrower | Loan Amount |
|---|---|---|---|
| Previous Owner | Stephens John Rory | $46,900 |
Source: Public Records
Tax History
| Year | Tax Paid | Tax Assessment Tax Assessment Total Assessment is a certain percentage of the fair market value that is determined by local assessors to be the total taxable value of land and additions on the property. | Land | Improvement |
|---|---|---|---|---|
| 2025 | $1,773 | $105,864 | $16,286 | $89,578 |
| 2024 | $1,587 | $103,789 | $15,967 | $87,822 |
| 2023 | $1,569 | $101,754 | $15,654 | $86,100 |
| 2022 | $1,544 | $99,759 | $15,347 | $84,412 |
| 2021 | $1,510 | $97,803 | $15,046 | $82,757 |
| 2020 | $1,489 | $96,800 | $14,892 | $81,908 |
| 2019 | $1,461 | $94,902 | $14,600 | $80,302 |
| 2018 | $1,427 | $93,041 | $14,314 | $78,727 |
| 2017 | $1,406 | $91,216 | $14,033 | $77,183 |
| 2016 | $1,208 | $89,428 | $13,758 | $75,670 |
| 2015 | -- | $88,084 | $13,551 | $74,533 |
| 2014 | $1,173 | $86,359 | $13,286 | $73,073 |
Source: Public Records
Map
Nearby Homes
- 0 Matawan Rd
- 12850 Lakota Rd
- 20958 Nisqually Rd
- 20726 Nisqually Rd
- 0 Rancho Rd Unit HD26024460
- 20715 Teton Rd
- 21021 Geronimo Rd
- 13100 Skiomah Rd
- 12655 Pocono Rd
- 21275 Pocomoke Rd
- 12765 Pocomoke Rd
- 21224 Vidal Ct
- 13099 Pocono Rd
- 13206 Winona Rd
- 12563 Sarsi Ct
- 12574 Sarsi Ct
- 12443 Bannock Dr
- 2222 Ottawa Rd
- 13073 Mohawk Rd
- 12999 Algonquin Rd
- 12786 Kiowa Rd
- 12814 Kiowa Rd
- 12795 Sholic Rd
- 12781 Sholic Rd
- 12781 Sholic (Subject To Cnx )
- 12807 Sholic Rd
- 12832 Kiowa Rd
- 12766 Kiowa Rd
- 38147 Matawan Rd
- 12795 Kiowa Rd
- 12813 Kiowa Rd
- 12783 Kiowa Rd
- 12828 Kiowa Rd
- 12769 Kiowa Rd Unit 3
- 12769 Kiowa Rd Unit 2
- 12769 Kiowa Rd Unit 1
- 12769 Kiowa Rd
- 12823 Sholic Rd
- 12746 Kiowa Rd
- 20881 Sitting Bull Rd
Your Personal Tour Guide
Ask me questions while you tour the home.