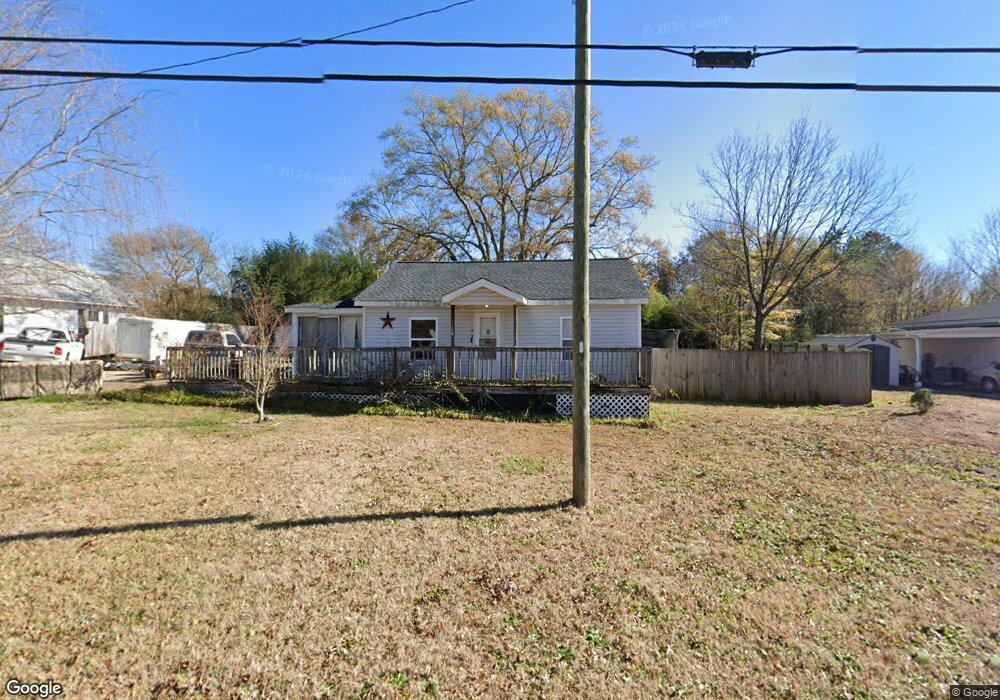
128 Christopher St Duncan, SC 29334
Estimated Value: $154,000 - $206,000
3
Beds
1
Bath
1,058
Sq Ft
$172/Sq Ft
Est. Value
About This Home
This home is located at 128 Christopher St, Duncan, SC 29334 and is currently estimated at $181,682, approximately $171 per square foot. 128 Christopher St is a home located in Spartanburg County with nearby schools including Duncan Elementary School, Byrnes Freshman Academy, and Beech Springs Intermediate School.
Ownership History
Date
Name
Owned For
Owner Type
Purchase Details
Closed on
Nov 10, 2016
Sold by
Charles E Friedline
Bought by
Sprouse Jhawnluc
Current Estimated Value
Home Financials for this Owner
Home Financials are based on the most recent Mortgage that was taken out on this home.
Original Mortgage
$80,514
Outstanding Balance
$64,943
Interest Rate
3.57%
Estimated Equity
$116,739
Purchase Details
Closed on
Jun 10, 2011
Sold by
Reece Robert
Bought by
Friedline Charles E and Friedline Diana
Home Financials for this Owner
Home Financials are based on the most recent Mortgage that was taken out on this home.
Original Mortgage
$52,331
Interest Rate
4.65%
Mortgage Type
Future Advance Clause Open End Mortgage
Purchase Details
Closed on
Jun 18, 2008
Sold by
Baker Cheryl P
Bought by
Deutsche Bank National Trust Co and Morgan Stanley Dean Witter Capital 1 Inc
Purchase Details
Closed on
Jun 11, 2001
Sold by
Henerey James E and Henerey Naomi J
Bought by
Baker Cheryl P
Create a Home Valuation Report for This Property
The Home Valuation Report is an in-depth analysis detailing your home's value as well as a comparison with similar homes in the area
Home Values in the Area
Average Home Value in this Area
Purchase History
| Date | Buyer | Sale Price | Title Company |
|---|---|---|---|
| Sprouse Jhawnluc | -- | -- | |
| Friedline Charles E | $48,000 | -- | |
| Deutsche Bank National Trust Co | $50,875 | -- | |
| Baker Cheryl P | $50,000 | -- |
Source: Public Records
Mortgage History
| Date | Status | Borrower | Loan Amount |
|---|---|---|---|
| Open | Sprouse Jhawnluc | $80,514 | |
| Closed | Sprouse Jhawnluc | -- | |
| Previous Owner | Friedline Charles E | $52,331 |
Source: Public Records
Tax History
| Year | Tax Paid | Tax Assessment Tax Assessment Total Assessment is a certain percentage of the fair market value that is determined by local assessors to be the total taxable value of land and additions on the property. | Land | Improvement |
|---|---|---|---|---|
| 2025 | $1,043 | $4,354 | $943 | $3,411 |
| 2024 | $1,043 | $4,354 | $943 | $3,411 |
| 2023 | $1,043 | $4,354 | $943 | $3,411 |
| 2022 | $942 | $3,786 | $614 | $3,172 |
| 2021 | $922 | $3,786 | $614 | $3,172 |
| 2020 | $907 | $3,786 | $614 | $3,172 |
| 2019 | $900 | $3,786 | $614 | $3,172 |
| 2018 | $2,449 | $5,679 | $921 | $4,758 |
| 2017 | $2,182 | $4,938 | $900 | $4,038 |
| 2016 | $523 | $2,116 | $593 | $1,523 |
| 2015 | $511 | $2,115 | $593 | $1,522 |
| 2014 | $504 | $2,115 | $593 | $1,522 |
Source: Public Records
Map
Nearby Homes
- 116 Johnson St
- 000 S Church St
- 124 Lyman Ave
- 120 Lyman Ave
- 128 Lyman Ave
- 138 S Church St
- 768 Cannonsburg Dr
- 148 N Church St
- 290 Forest Lake Rd
- 296 Forest Lake Rd
- 142 Hughes St
- 224 Hotchkiss Ln
- 170 Spartanburg Rd
- 100 Holly Dr
- 0 S Danzler Rd Unit 7362340
- 198 Spring St
- 92 North St
- 101 Greer St
- 123 Sunny Ray Dr
- 3 Pacific St
- 126 Christopher St
- 130 Christopher St
- 124 Christopher St
- 129 Christopher St
- 131 Christopher St
- 127 Christopher St
- 132 Christopher St
- 125 Christopher St
- 122 Christopher St
- 123 Christopher St
- 134 Christopher St
- 120 Christopher St
- 121 Christopher St
- 101 Johnson St
- 136 Christopher St
- 118 Christopher St
- 102 Johnson St
- 119 Christopher St
- 116 Christopher St
- 138 Christopher St
Your Personal Tour Guide
Ask me questions while you tour the home.