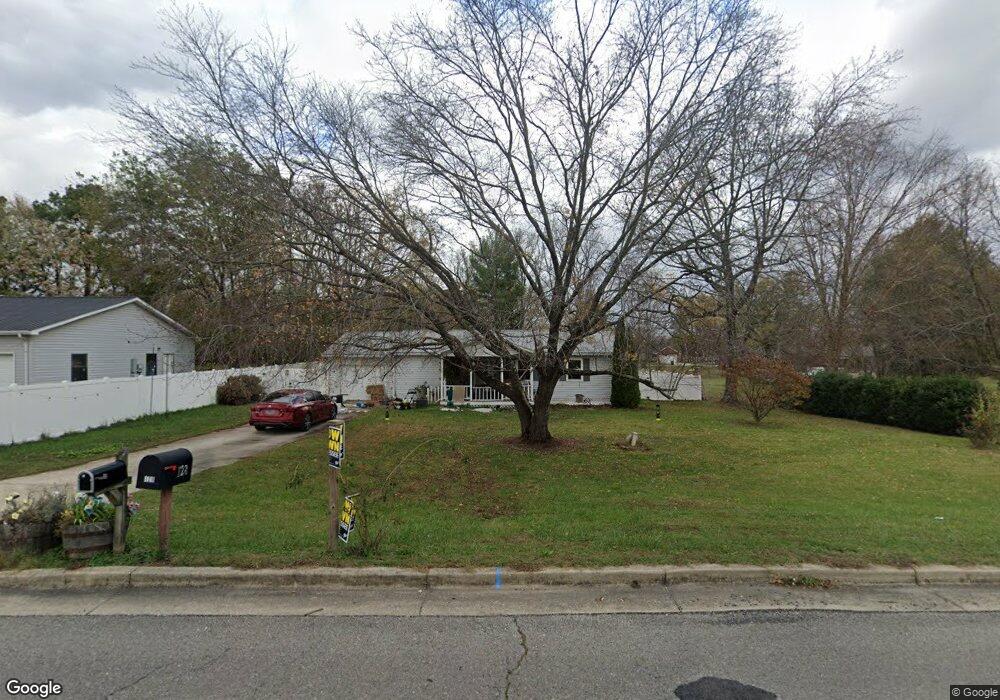
128 Cooper Rd Cookeville, TN 38506
Estimated Value: $196,439 - $286,000
--
Bed
2
Baths
1,050
Sq Ft
$224/Sq Ft
Est. Value
About This Home
This home is located at 128 Cooper Rd, Cookeville, TN 38506 and is currently estimated at $234,860, approximately $223 per square foot. 128 Cooper Rd is a home located in Putnam County with nearby schools including Algood Elementary School, Algood Middle School, and Cookeville High School.
Ownership History
Date
Name
Owned For
Owner Type
Purchase Details
Closed on
Jan 27, 2021
Sold by
Perron Benedict Joseph
Bought by
Perron Benedict Joseph and Benedict Joseph Perron Jr 2021
Current Estimated Value
Purchase Details
Closed on
Oct 29, 2014
Sold by
Phillips Bobby
Bought by
Perron Benedict Joseph
Purchase Details
Closed on
Aug 2, 2010
Sold by
Cooper Samuel Howard
Bought by
Phillips Bobby
Purchase Details
Closed on
Jun 22, 2005
Sold by
Howard Cooper
Bought by
Ammons John R and Ammons Wilma
Purchase Details
Closed on
Oct 18, 2001
Sold by
Stephen Essler and Stephen Brenda
Bought by
Howard Cooper and Howard Winnie
Purchase Details
Closed on
Oct 16, 2001
Bought by
Cooper Howard and Cooper Winnie
Purchase Details
Closed on
Jan 24, 1989
Bought by
Essler Stephen Brenda
Purchase Details
Closed on
Jan 28, 1988
Bought by
Stephenson Paul G
Purchase Details
Closed on
Mar 16, 1968
Bought by
Clark Della S
Purchase Details
Closed on
Apr 19, 1964
Create a Home Valuation Report for This Property
The Home Valuation Report is an in-depth analysis detailing your home's value as well as a comparison with similar homes in the area
Home Values in the Area
Average Home Value in this Area
Purchase History
| Date | Buyer | Sale Price | Title Company |
|---|---|---|---|
| Perron Benedict Joseph | -- | None Available | |
| Perron Benedict Joseph | $75,000 | -- | |
| Phillips Bobby | $75,000 | -- | |
| Ammons John R | $66,700 | -- | |
| Howard Cooper | $15,452 | -- | |
| Cooper Howard | $15,500 | -- | |
| Essler Stephen Brenda | $39,500 | -- | |
| Stephenson Paul G | -- | -- | |
| Clark Della S | -- | -- | |
| -- | -- | -- |
Source: Public Records
Tax History Compared to Growth
Tax History
| Year | Tax Paid | Tax Assessment Tax Assessment Total Assessment is a certain percentage of the fair market value that is determined by local assessors to be the total taxable value of land and additions on the property. | Land | Improvement |
|---|---|---|---|---|
| 2024 | $726 | $27,300 | $3,750 | $23,550 |
| 2023 | $726 | $27,300 | $3,750 | $23,550 |
| 2022 | $675 | $27,300 | $3,750 | $23,550 |
| 2021 | $774 | $27,300 | $3,750 | $23,550 |
| 2020 | $568 | $27,300 | $3,750 | $23,550 |
| 2019 | $654 | $19,425 | $3,750 | $15,675 |
| 2018 | $625 | $19,425 | $3,750 | $15,675 |
| 2017 | $625 | $19,425 | $3,750 | $15,675 |
| 2016 | $630 | $19,425 | $3,750 | $15,675 |
| 2015 | $630 | $19,425 | $3,750 | $15,675 |
| 2014 | $625 | $18,847 | $0 | $0 |
Source: Public Records
Map
Nearby Homes
- 134 Cooper Rd
- 117 Cooper Rd
- 343 Dry Valley Rd
- 321 Dry Valley Rd
- 105 Gresham Dr
- 121 Cooper Rd
- 129 Cooper Rd
- 119 Cooper Rd
- 140 Cooper Rd
- 115 Cooper Rd
- 109 Gresham Dr
- 357 Dry Valley Rd Unit 363
- 113 Cooper Rd
- 111 Cooper Rd
- 303 Dry Valley Rd
- 10 AC Dry Valley Rd
- 8 Acres Dry Valley Rd
- LOT 4 Dry Valley Rd
- 0 Dry Valley Rd
- 105 Stover Dr