Estimated Value: $426,000 - $468,000
3
Beds
2
Baths
1,062
Sq Ft
$423/Sq Ft
Est. Value
About This Home
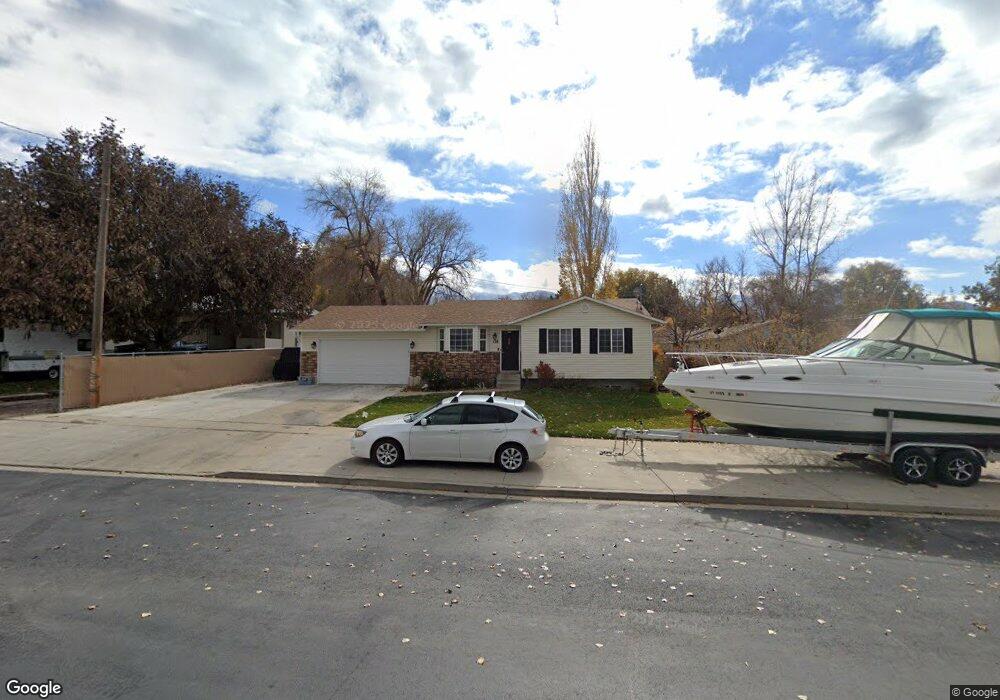
This home is located at 128 E 100 S, Salem, UT 84653 and is currently estimated at $448,775, approximately $422 per square foot. 128 E 100 S is a home located in Utah County with nearby schools including Salem Elementary, Salem Junior High School, and Valley View Middle School.
Ownership History
Date
Name
Owned For
Owner Type
Purchase Details
Closed on
Jul 25, 2003
Sold by
Whiteman Andy J and Whiteman Brandy L
Bought by
Whiteman Brandy L
Current Estimated Value
Home Financials for this Owner
Home Financials are based on the most recent Mortgage that was taken out on this home.
Original Mortgage
$116,000
Outstanding Balance
$48,834
Interest Rate
5.13%
Mortgage Type
Purchase Money Mortgage
Estimated Equity
$399,941
Purchase Details
Closed on
Jul 9, 1999
Sold by
Nixon Brothers Construction Company
Bought by
Whiteman Andy J and Whiteman Brandy L
Home Financials for this Owner
Home Financials are based on the most recent Mortgage that was taken out on this home.
Original Mortgage
$115,000
Interest Rate
7.24%
Create a Home Valuation Report for This Property
The Home Valuation Report is an in-depth analysis detailing your home's value as well as a comparison with similar homes in the area
Home Values in the Area
Average Home Value in this Area
Purchase History
| Date | Buyer | Sale Price | Title Company |
|---|---|---|---|
| Whiteman Brandy L | -- | Provo Land Title Company | |
| Whiteman Andy J | -- | Access Title Company |
Source: Public Records
Mortgage History
| Date | Status | Borrower | Loan Amount |
|---|---|---|---|
| Open | Whiteman Brandy L | $116,000 | |
| Closed | Whiteman Andy J | $115,000 |
Source: Public Records
Tax History
| Year | Tax Paid | Tax Assessment Tax Assessment Total Assessment is a certain percentage of the fair market value that is determined by local assessors to be the total taxable value of land and additions on the property. | Land | Improvement |
|---|---|---|---|---|
| 2025 | $2,030 | $229,515 | -- | -- |
| 2024 | $2,030 | $205,865 | $0 | $0 |
| 2023 | $2,011 | $204,325 | $0 | $0 |
| 2022 | $1,925 | $192,555 | $0 | $0 |
| 2021 | $1,541 | $247,300 | $95,500 | $151,800 |
| 2020 | $1,473 | $230,000 | $86,800 | $143,200 |
| 2019 | $1,281 | $204,400 | $83,000 | $121,400 |
| 2018 | $1,188 | $181,100 | $75,500 | $105,600 |
| 2017 | $1,070 | $87,010 | $0 | $0 |
| 2016 | $960 | $77,110 | $0 | $0 |
| 2015 | $878 | $69,300 | $0 | $0 |
| 2014 | $877 | $69,300 | $0 | $0 |
Source: Public Records
Map
Nearby Homes
- 121 S Main St
- 205 E Center St
- 412 S 100 E
- 390 S Salem Lake Dr
- 253 N 100 E
- 567 S Hazel Dr
- 84 N 500 E
- 432 E 300 N Unit 12
- 315 N 500 E
- 6 Shady Ln
- 173 W 650 S Unit 10
- 481 W 705 S Unit 2
- 643-1209 N 1850 E
- 438 N 500 E Unit LOT 2
- 1223 N 360 E Unit 129
- 1212 N 360 E Unit 132
- 1195 N 360 E Unit 127
- 1241 N 360 E Unit 130
- 1238 N 360 E Unit 133
- 1207 N 360 E Unit 128
Your Personal Tour Guide
Ask me questions while you tour the home.