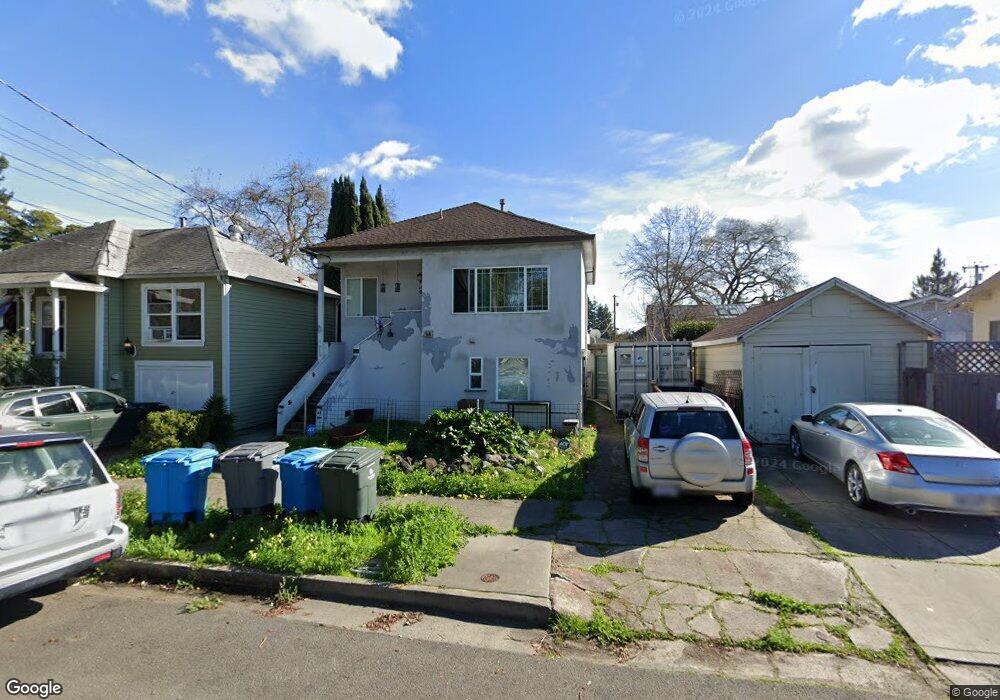
128 Hewett St Santa Rosa, CA 95401
Historic Railroad Square NeighborhoodEstimated Value: $787,000 - $1,273,000
3
Beds
4
Baths
2,724
Sq Ft
$354/Sq Ft
Est. Value
About This Home
This home is located at 128 Hewett St, Santa Rosa, CA 95401 and is currently estimated at $963,333, approximately $353 per square foot. 128 Hewett St is a home located in Sonoma County with nearby schools including Abraham Lincoln Elementary School, Santa Rosa Middle School, and Santa Rosa High School.
Ownership History
Date
Name
Owned For
Owner Type
Purchase Details
Closed on
Dec 24, 2024
Sold by
Siedentopf Andre Charles and Siedentopf Andre C
Bought by
Siedentopf Andre C
Current Estimated Value
Home Financials for this Owner
Home Financials are based on the most recent Mortgage that was taken out on this home.
Original Mortgage
$120,000
Outstanding Balance
$119,054
Interest Rate
6.78%
Mortgage Type
New Conventional
Estimated Equity
$844,279
Purchase Details
Closed on
May 14, 2024
Sold by
Siedentopf Andre Charles and Siedentopf Traci Anne
Bought by
Siedentopf Andre Charles
Purchase Details
Closed on
Jun 14, 2003
Sold by
Siedentopf Andre Charles
Bought by
Siedentopf Andre Charles and Siedentopf Traci Anne
Purchase Details
Closed on
Jun 12, 2003
Sold by
Siedentopf Andre Charles and Siedentopf Eric D
Bought by
Siedentopf Andre Charles
Create a Home Valuation Report for This Property
The Home Valuation Report is an in-depth analysis detailing your home's value as well as a comparison with similar homes in the area
Home Values in the Area
Average Home Value in this Area
Purchase History
| Date | Buyer | Sale Price | Title Company |
|---|---|---|---|
| Siedentopf Andre C | -- | First American Title | |
| Siedentopf Andre C | -- | First American Title | |
| Siedentopf Andre Charles | -- | None Listed On Document | |
| Siedentopf Andre Charles | -- | -- | |
| Siedentopf Andre Charles | -- | -- |
Source: Public Records
Mortgage History
| Date | Status | Borrower | Loan Amount |
|---|---|---|---|
| Open | Siedentopf Andre C | $120,000 | |
| Closed | Siedentopf Andre C | $120,000 |
Source: Public Records
Tax History Compared to Growth
Tax History
| Year | Tax Paid | Tax Assessment Tax Assessment Total Assessment is a certain percentage of the fair market value that is determined by local assessors to be the total taxable value of land and additions on the property. | Land | Improvement |
|---|---|---|---|---|
| 2025 | $1,141 | $101,085 | $9,598 | $91,487 |
| 2024 | $1,141 | $99,104 | $9,410 | $89,694 |
| 2023 | $1,141 | $97,162 | $9,226 | $87,936 |
| 2022 | $1,054 | $95,258 | $9,046 | $86,212 |
| 2021 | $1,039 | $93,391 | $8,869 | $84,522 |
| 2020 | $1,036 | $92,435 | $8,779 | $83,656 |
| 2019 | $1,028 | $90,623 | $8,607 | $82,016 |
| 2018 | $1,020 | $88,847 | $8,439 | $80,408 |
| 2017 | $1,001 | $87,106 | $8,274 | $78,832 |
| 2016 | $982 | $85,399 | $8,112 | $77,287 |
| 2015 | $941 | $84,118 | $7,991 | $76,127 |
| 2014 | $884 | $82,471 | $7,835 | $74,636 |
Source: Public Records
Map
Nearby Homes
- 100 W 8th St
- 303 Hewett St
- 223 Decker St
- 743 Davis St
- 415 Duncan St
- 164 N Dutton Ave Unit 7
- 209 Decoe St
- 709 W 8th St
- 919 Kingwood St
- 432 8th St
- 730 Hewett St
- 595 N Dutton Ave
- 493 Umland Dr
- 433 Blythewood Place
- 714 Mendocino Ave
- 542 College Ave
- 517 Boyd St
- 706 Simpson Place
- 740 Mendocino Ave
- 788 Simpson Place