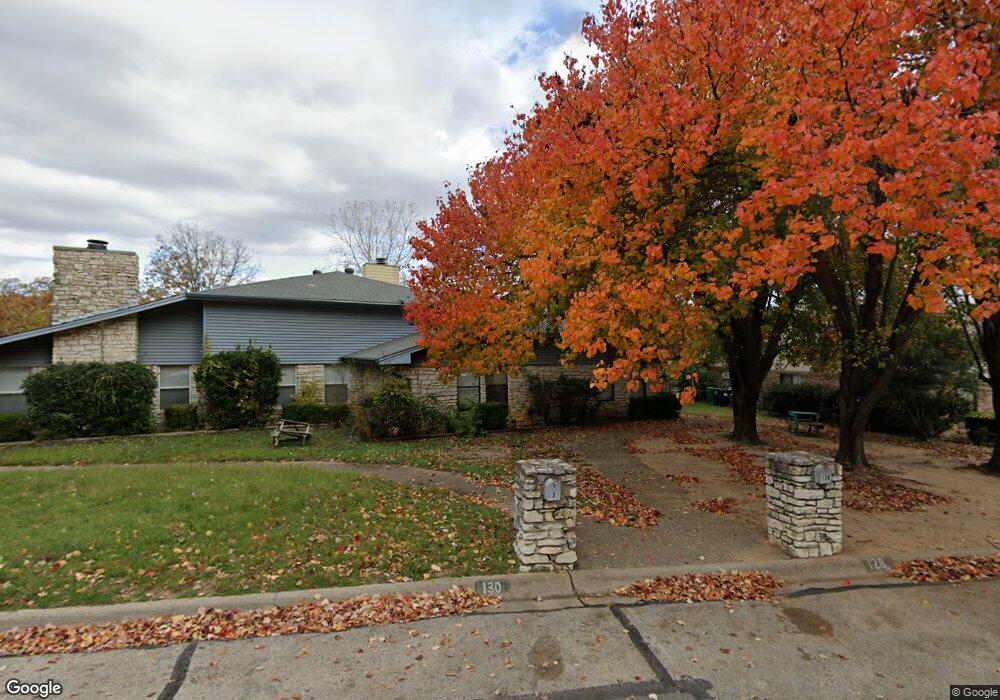
128 Hollyhill Ln Unit 130 Denton, TX 76205
South Denton NeighborhoodEstimated Value: $460,063 - $744,000
4
Beds
2
Baths
3,829
Sq Ft
$162/Sq Ft
Est. Value
About This Home
This home is located at 128 Hollyhill Ln Unit 130, Denton, TX 76205 and is currently estimated at $621,766, approximately $162 per square foot. 128 Hollyhill Ln Unit 130 is a home located in Denton County with nearby schools including Houston Elementary School, McMath Middle School, and Denton High School.
Ownership History
Date
Name
Owned For
Owner Type
Purchase Details
Closed on
Dec 5, 2019
Sold by
Fera Sabit and Fera Ibadet
Bought by
Fera Sabir
Current Estimated Value
Home Financials for this Owner
Home Financials are based on the most recent Mortgage that was taken out on this home.
Original Mortgage
$206,000
Outstanding Balance
$182,150
Interest Rate
3.75%
Mortgage Type
New Conventional
Estimated Equity
$439,616
Purchase Details
Closed on
Dec 2, 2011
Sold by
Ahmeti Flamur
Bought by
Fera Sabit
Purchase Details
Closed on
Mar 18, 2011
Sold by
Fannie Mae
Bought by
Ahmeti Flamur
Purchase Details
Closed on
Jan 4, 2011
Sold by
Ogbe Cymetria S and Ogbe Jamal
Bought by
Federal National Mortgage Association
Create a Home Valuation Report for This Property
The Home Valuation Report is an in-depth analysis detailing your home's value as well as a comparison with similar homes in the area
Home Values in the Area
Average Home Value in this Area
Purchase History
| Date | Buyer | Sale Price | Title Company |
|---|---|---|---|
| Fera Sabir | -- | Title Resources | |
| Fera Sabit | -- | None Available | |
| Ahmeti Flamur | -- | Old Republic National Title | |
| Federal National Mortgage Association | $226,730 | None Available |
Source: Public Records
Mortgage History
| Date | Status | Borrower | Loan Amount |
|---|---|---|---|
| Open | Fera Sabir | $206,000 |
Source: Public Records
Tax History Compared to Growth
Tax History
| Year | Tax Paid | Tax Assessment Tax Assessment Total Assessment is a certain percentage of the fair market value that is determined by local assessors to be the total taxable value of land and additions on the property. | Land | Improvement |
|---|---|---|---|---|
| 2025 | $7,508 | $395,000 | $106,896 | $288,104 |
| 2024 | $7,508 | $389,000 | $106,896 | $282,104 |
| 2023 | $7,427 | $389,000 | $101,486 | $287,514 |
| 2022 | $7,111 | $335,000 | $91,099 | $243,901 |
| 2021 | $5,980 | $269,000 | $62,880 | $206,120 |
| 2020 | $6,149 | $269,000 | $62,880 | $206,120 |
| 2019 | $3,301 | $138,355 | $31,440 | $106,915 |
| 2018 | $3,272 | $135,456 | $31,440 | $104,016 |
| 2017 | $5,734 | $232,000 | $62,880 | $169,120 |
| 2016 | $2,942 | $119,018 | $31,440 | $87,578 |
| 2015 | -- | $112,702 | $31,440 | $81,262 |
Source: Public Records
Map
Nearby Homes
- 408 Hollyhill Ln
- 412 Hollyhill Ln Unit 412
- 1500 Sandy Creek Dr
- 209 Pennsylvania Dr
- 1412 Ridgecrest Cir
- 2218 Southridge Dr
- 2012 Hollyhill Ln
- 1541 Valley Creek Rd
- 1536 Valley Creek Rd
- 1508 Kenwood St
- 924 Ridgecrest Cir
- 1517 Valley Creek Rd
- 1512 Valley Creek Rd
- 2100 Fairfax Rd
- 1330 Laredo Ct
- 1501 Valley Creek Rd
- 2120 Fairfax Rd
- 1311 Wilderness St
- 1237 Dallas Dr
- 2253 Hollyhill Ln
- 130 Hollyhill Ln
- 200 Hollyhill Ln
- 200 Hollyhill Ln Unit 202
- 202 Hollyhill Ln Unit 202
- 124 Hollyhill Ln Unit 126
- 124-126 Hollyhill Ln
- 126 Hollyhill Ln
- 2308 Birchbrook Ct
- 2304 Birchbrook Ct
- 2310 Birchbrook Ct
- 1803 Concord Ln
- 204 Hollyhill Ln
- 122 Hollyhill Ln
- 2205 Canterbury Ct
- 120 Hollyhill Ln Unit 122
- 2305 Birchbrook Ct
- 1800 Concord Ln
- 2302 Birchbrook Ct
- 2300 Birchbrook Ct
- 2201 Canterbury Ct