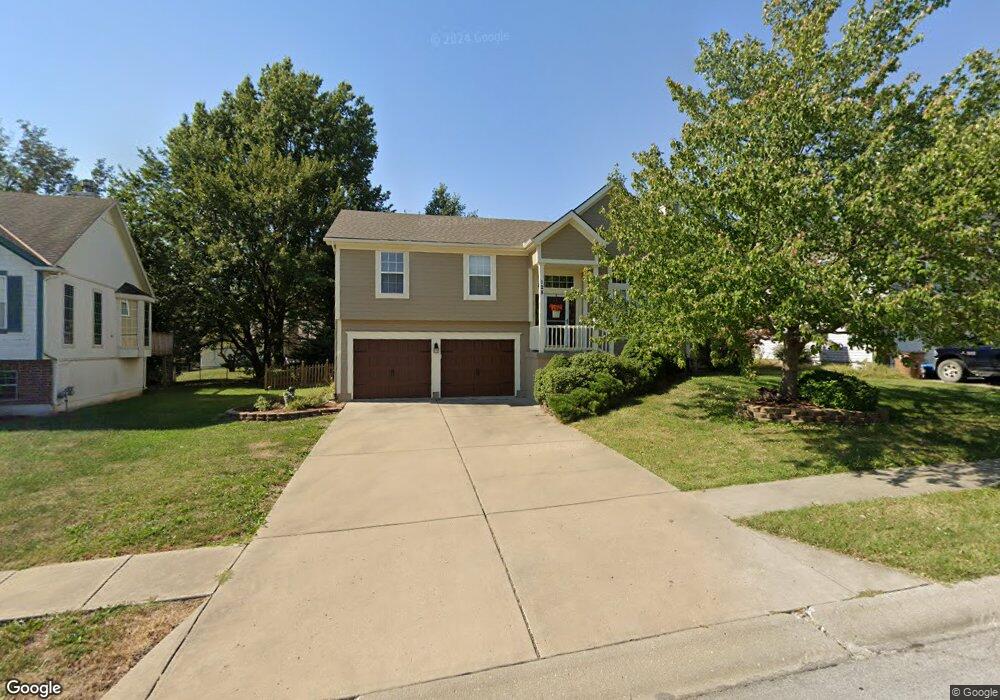
128 N Highland Dr Raymore, MO 64083
Estimated Value: $321,000 - $330,000
3
Beds
3
Baths
1,314
Sq Ft
$247/Sq Ft
Est. Value
About This Home
This home is located at 128 N Highland Dr, Raymore, MO 64083 and is currently estimated at $325,158, approximately $247 per square foot. 128 N Highland Dr is a home located in Cass County with nearby schools including Eagle Glen Intermediate School, Raymore-Peculiar East Middle School, and Raymore-Peculiar Senior High School.
Ownership History
Date
Name
Owned For
Owner Type
Purchase Details
Closed on
Aug 6, 2019
Sold by
Leinbach Jerry A and Leinbach Cynthia P
Bought by
Rockey David and Rockey Martha
Current Estimated Value
Home Financials for this Owner
Home Financials are based on the most recent Mortgage that was taken out on this home.
Original Mortgage
$150,000
Outstanding Balance
$130,884
Interest Rate
3.73%
Mortgage Type
New Conventional
Estimated Equity
$194,274
Purchase Details
Closed on
Jun 30, 2014
Sold by
Leinbach Karen I and Eastland David
Bought by
Leinbach Jerry A
Purchase Details
Closed on
Feb 11, 2008
Sold by
Aurona Loan Services Llc
Bought by
Leinbach Jerry A and Leinbach Karen I
Home Financials for this Owner
Home Financials are based on the most recent Mortgage that was taken out on this home.
Original Mortgage
$108,800
Interest Rate
5.72%
Mortgage Type
New Conventional
Purchase Details
Closed on
Aug 20, 2007
Sold by
Buffington Joe and Buffington Terri
Bought by
Aurora Loan Services Llc
Create a Home Valuation Report for This Property
The Home Valuation Report is an in-depth analysis detailing your home's value as well as a comparison with similar homes in the area
Home Values in the Area
Average Home Value in this Area
Purchase History
| Date | Buyer | Sale Price | Title Company |
|---|---|---|---|
| Rockey David | -- | Stewart Title Company | |
| Leinbach Jerry A | -- | None Available | |
| Leinbach Jerry A | -- | -- | |
| Aurora Loan Services Llc | -- | -- |
Source: Public Records
Mortgage History
| Date | Status | Borrower | Loan Amount |
|---|---|---|---|
| Open | Rockey David | $150,000 | |
| Previous Owner | Leinbach Jerry A | $108,800 |
Source: Public Records
Tax History
| Year | Tax Paid | Tax Assessment Tax Assessment Total Assessment is a certain percentage of the fair market value that is determined by local assessors to be the total taxable value of land and additions on the property. | Land | Improvement |
|---|---|---|---|---|
| 2025 | $2,751 | $37,810 | $4,850 | $32,960 |
| 2024 | $2,751 | $33,800 | $4,400 | $29,400 |
| 2023 | $2,747 | $33,800 | $4,400 | $29,400 |
| 2022 | $2,505 | $30,620 | $4,400 | $26,220 |
| 2021 | $2,505 | $30,620 | $4,400 | $26,220 |
| 2020 | $2,461 | $29,540 | $4,400 | $25,140 |
| 2019 | $2,375 | $29,540 | $4,400 | $25,140 |
| 2018 | $2,198 | $26,390 | $3,710 | $22,680 |
| 2017 | $2,008 | $26,390 | $3,710 | $22,680 |
| 2016 | $2,008 | $25,030 | $3,710 | $21,320 |
| 2015 | $2,009 | $25,030 | $3,710 | $21,320 |
| 2014 | $2,010 | $25,030 | $3,710 | $21,320 |
| 2013 | -- | $25,030 | $3,710 | $21,320 |
Source: Public Records
Map
Nearby Homes
- 205 N Pacific Ct
- 105 N Landcaster Dr
- 108 Rainbow Cir
- 208 N Pacific Ct
- 201 Johnston Dr
- 205 Johnston Pkwy
- 1105 Brookside Place
- 113 N Eastglen Dr
- 1206 Johnston Dr
- 615 N Conway St
- 701 Hampstead Dr
- 600 W Buena Vista Dr
- 110 S Westglen Dr
- 222 N Madison St
- 1108 Yokley Dr
- 901 W Lucy Webb Rd
- 1206 W Lucy Webb Rd
- 416 S Jefferson St
- 317 & 319 W Foxwood Dr
- 411 Eagle Glen Dr
- 30676 Corte Padrera Unit PADRERA
- 130 N Highland Dr
- 126 N Highland Dr
- 103 Johnston Pkwy
- 132 N Highland Dr
- 124 N Highland Dr
- 105 Johnston Pkwy
- 129 N Highland Dr
- 100 Silver Lake Cir
- 131 N Highland Dr
- 107 Johnston Pkwy
- 134 N Highland Dr
- 127 N Highland Dr
- 122 N Highland Dr
- 102 Silver Lake Cir
- 135 N Highland Dr
- 109 Johnston Pkwy
- 904 Silver Lake Cir
- 136 N Highland Dr
- 125 N Highland Dr
Your Personal Tour Guide
Ask me questions while you tour the home.