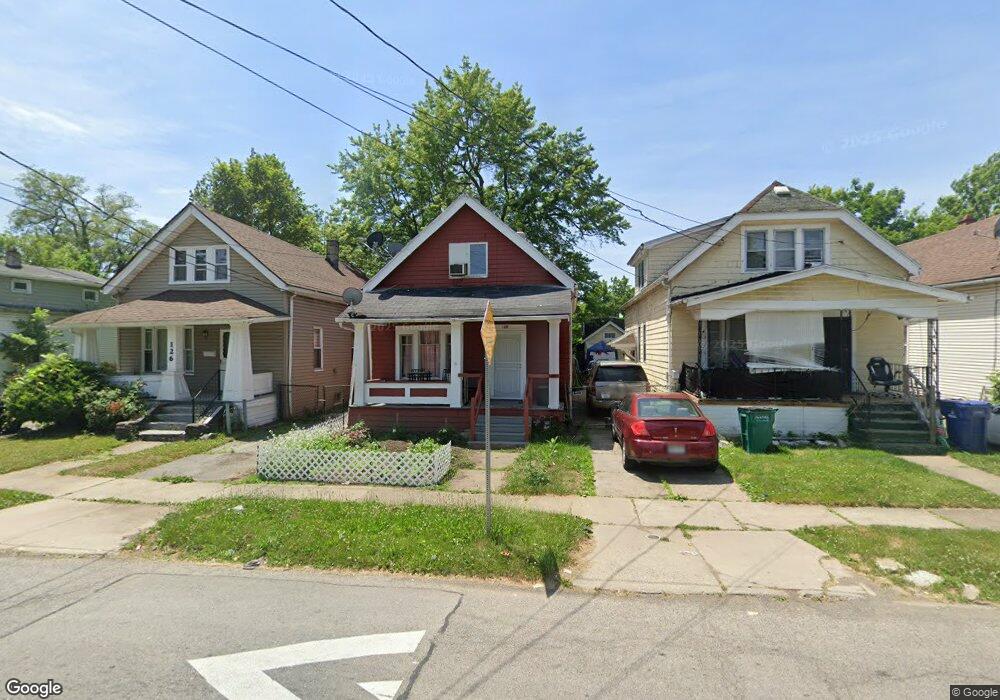
128 Olympic Ave Buffalo, NY 14215
Kenfield NeighborhoodEstimated Value: $72,287 - $96,000
3
Beds
1
Bath
1,119
Sq Ft
$72/Sq Ft
Est. Value
About This Home
This home is located at 128 Olympic Ave, Buffalo, NY 14215 and is currently estimated at $80,762, approximately $72 per square foot. 128 Olympic Ave is a home located in Erie County with nearby schools including King Center Charter School and Nativitymiguel Middle School - Buffalo.
Ownership History
Date
Name
Owned For
Owner Type
Purchase Details
Closed on
Jan 14, 2025
Sold by
Hossain Kazi Mohammed
Bought by
Akter Mosammath Nasima
Current Estimated Value
Purchase Details
Closed on
Mar 12, 2021
Sold by
Reitz Mary
Bought by
Hossain Kazi Mohammed
Purchase Details
Closed on
Dec 2, 2014
Sold by
Armitage Holdings Llc
Bought by
Queen City Invest Llc
Purchase Details
Closed on
Mar 23, 2009
Sold by
Helenbrook Jeffrey W and Helenbrook Ingeborg
Bought by
Helenbrook Ingeborg
Purchase Details
Closed on
Jul 25, 2000
Sold by
First Union National Bank
Bought by
Helenbrook Jeffrey W and Helenbrook Ingeborg
Purchase Details
Closed on
Oct 24, 1995
Sold by
Suriani Anthony and Suriani Catherine
Bought by
Sanders John
Create a Home Valuation Report for This Property
The Home Valuation Report is an in-depth analysis detailing your home's value as well as a comparison with similar homes in the area
Home Values in the Area
Average Home Value in this Area
Purchase History
| Date | Buyer | Sale Price | Title Company |
|---|---|---|---|
| Akter Mosammath Nasima | $62,000 | None Available | |
| Akter Mosammath Nasima | $62,000 | None Available | |
| Hossain Kazi Mohammed | $60,000 | None Available | |
| Hossain Kazi Mohammed | $60,000 | None Available | |
| Hossain Kazi Mohammed | $60,000 | None Available | |
| Queen City Invest Llc | $92,000 | None Available | |
| Queen City Invest Llc | $92,000 | None Available | |
| Queen City Invest Llc | $92,000 | None Available | |
| Helenbrook Ingeborg | -- | None Available | |
| Helenbrook Ingeborg | -- | None Available | |
| Helenbrook Jeffrey W | $6,000 | -- | |
| Helenbrook Jeffrey W | $6,000 | -- | |
| Helenbrook Jeffrey W | $6,000 | -- | |
| Sanders John | $20,000 | -- | |
| Sanders John | $20,000 | -- |
Source: Public Records
Tax History
| Year | Tax Paid | Tax Assessment Tax Assessment Total Assessment is a certain percentage of the fair market value that is determined by local assessors to be the total taxable value of land and additions on the property. | Land | Improvement |
|---|---|---|---|---|
| 2024 | $241 | $43,000 | $4,200 | $38,800 |
| 2023 | $218 | $43,000 | $4,200 | $38,800 |
| 2022 | $216 | $43,000 | $4,200 | $38,800 |
| 2021 | $216 | $43,000 | $4,200 | $38,800 |
| 2020 | $247 | $43,000 | $4,200 | $38,800 |
| 2019 | $881 | $32,100 | $3,500 | $28,600 |
| 2018 | $829 | $32,100 | $3,500 | $28,600 |
| 2017 | $191 | $32,100 | $3,500 | $28,600 |
| 2016 | $781 | $32,100 | $3,500 | $28,600 |
| 2015 | -- | $32,100 | $3,500 | $28,600 |
| 2014 | -- | $32,100 | $3,500 | $28,600 |
Source: Public Records
Map
Nearby Homes
- 22 Schreck Ave
- 376 Norfolk Ave
- 39 Alma Ave
- 437 Cornwall Ave
- 90 Alma Ave
- 411 Cambridge Ave
- 417 Cambridge Ave
- 359 Cambridge Ave
- 315 Cornwall Ave
- 25 Proctor Ave
- 353 Warwick Ave
- 60 Weston Ave
- 94 Ericson Ave
- 572 Wyoming Ave
- 217 Wyoming Ave
- 586 Wyoming Ave
- 375 Olympic Ave
- 36 Fernhill Ave
- 358 Newburgh Ave
- 40 Ruspin Ave
- 132 Olympic Ave
- 126 Olympic Ave
- 136 Olympic Ave
- 120 Olympic Ave
- 138 Olympic Ave
- 140 Olympic Ave
- 118 Olympic Ave
- 116 Olympic Ave
- 142 Olympic Ave
- 7 Dorris Ave
- 114 Olympic Ave
- 146 Olympic Ave
- 11 Dorris Ave
- 2 Schreck Ave
- 110 Olympic Ave
- 2 Dorris Ave
- 4 Dorris Ave
- 152 Olympic Ave
- 102 Olympic Ave
- 4 Schreck Ave
Your Personal Tour Guide
Ask me questions while you tour the home.