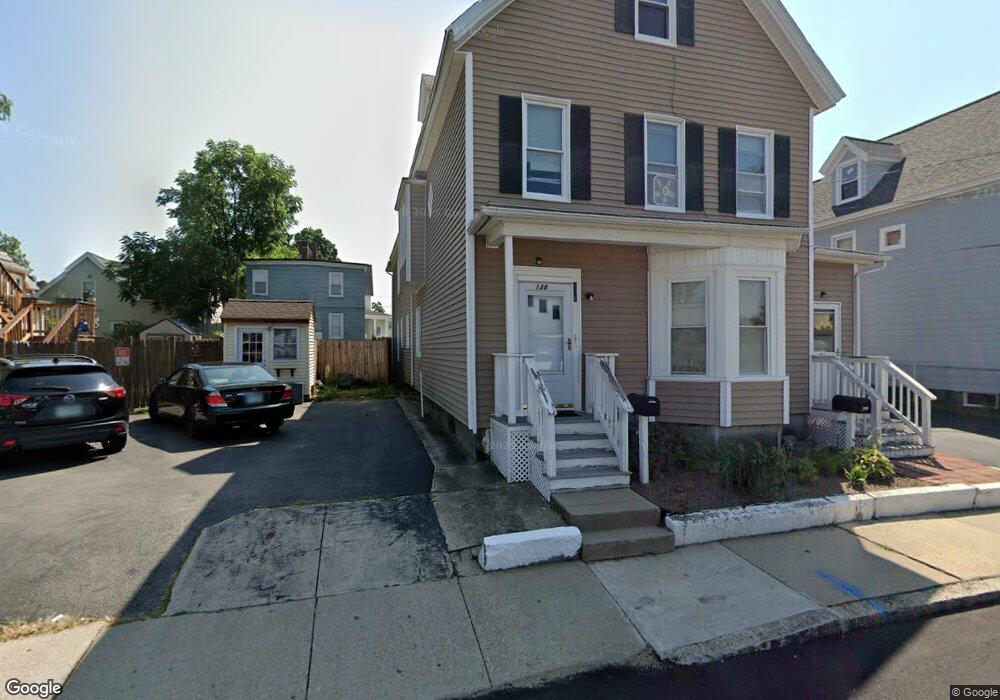
128 Pine St Nashua, NH 03060
South End Nashua NeighborhoodEstimated Value: $475,000 - $561,000
4
Beds
2
Baths
2,494
Sq Ft
$213/Sq Ft
Est. Value
About This Home
This home is located at 128 Pine St, Nashua, NH 03060 and is currently estimated at $530,576, approximately $212 per square foot. 128 Pine St is a home located in Hillsborough County with nearby schools including Fairgrounds Elementary School, Elm Street Middle School, and Nashua High School South.
Ownership History
Date
Name
Owned For
Owner Type
Purchase Details
Closed on
Mar 30, 2009
Sold by
Fhlmc
Bought by
Dube Julie T and Dube Bertrand L
Current Estimated Value
Home Financials for this Owner
Home Financials are based on the most recent Mortgage that was taken out on this home.
Original Mortgage
$154,156
Interest Rate
5.14%
Mortgage Type
Purchase Money Mortgage
Purchase Details
Closed on
Aug 8, 2008
Sold by
Latti David M and Latti Fhlmc
Bought by
Fhlmc
Purchase Details
Closed on
Aug 27, 2004
Sold by
Croteau Theodore C
Bought by
Latti David M
Purchase Details
Closed on
Mar 3, 2003
Sold by
Latti David M
Bought by
Croteau Theodore C
Purchase Details
Closed on
Sep 28, 2000
Sold by
Kulow Bradford
Bought by
Latti David
Purchase Details
Closed on
Aug 30, 1999
Sold by
Pelletier Gary W
Bought by
Kulow Bradford R
Create a Home Valuation Report for This Property
The Home Valuation Report is an in-depth analysis detailing your home's value as well as a comparison with similar homes in the area
Home Values in the Area
Average Home Value in this Area
Purchase History
| Date | Buyer | Sale Price | Title Company |
|---|---|---|---|
| Dube Julie T | $157,100 | -- | |
| Fhlmc | $249,900 | -- | |
| Latti David M | $324,000 | -- | |
| Croteau Theodore C | $235,000 | -- | |
| Latti David | $154,000 | -- | |
| Kulow Bradford R | $106,500 | -- |
Source: Public Records
Mortgage History
| Date | Status | Borrower | Loan Amount |
|---|---|---|---|
| Open | Kulow Bradford R | $149,750 | |
| Closed | Kulow Bradford R | $154,156 | |
| Previous Owner | Kulow Bradford R | $304,000 |
Source: Public Records
Tax History
| Year | Tax Paid | Tax Assessment Tax Assessment Total Assessment is a certain percentage of the fair market value that is determined by local assessors to be the total taxable value of land and additions on the property. | Land | Improvement |
|---|---|---|---|---|
| 2025 | $8,092 | $480,800 | $109,400 | $371,400 |
| 2024 | $7,645 | $480,800 | $109,400 | $371,400 |
| 2023 | $7,115 | $390,300 | $87,600 | $302,700 |
| 2022 | $7,053 | $390,300 | $87,600 | $302,700 |
| 2021 | $5,789 | $249,300 | $58,400 | $190,900 |
| 2020 | $5,637 | $249,300 | $58,400 | $190,900 |
| 2019 | $5,425 | $249,300 | $58,400 | $190,900 |
| 2018 | $5,288 | $249,300 | $58,400 | $190,900 |
| 2017 | $4,054 | $157,200 | $56,800 | $100,400 |
| 2016 | $3,941 | $157,200 | $56,800 | $100,400 |
| 2015 | $3,856 | $157,200 | $56,800 | $100,400 |
| 2014 | $3,781 | $157,200 | $56,800 | $100,400 |
Source: Public Records
Map
Nearby Homes
- 130 Pine St
- 126 Pine St Unit 126B
- 124 Pine St
- 111 Palm St
- 111 Palm St Unit B
- 111 1/2 Palm St
- 132 Pine St Unit 134
- 113 Palm St
- 125 Pine St
- 115 Palm St Unit 1
- 115 Palm St
- 115 Palm St Unit 115B
- 115 Palm St Unit 1
- 115 Palm St Unit 2
- 115B Palm St Unit 2
- 115B Palm St
- 109 Palm St
- 11 Lovewell St
- 122 Pine St
- 107 Palm St
Your Personal Tour Guide
Ask me questions while you tour the home.