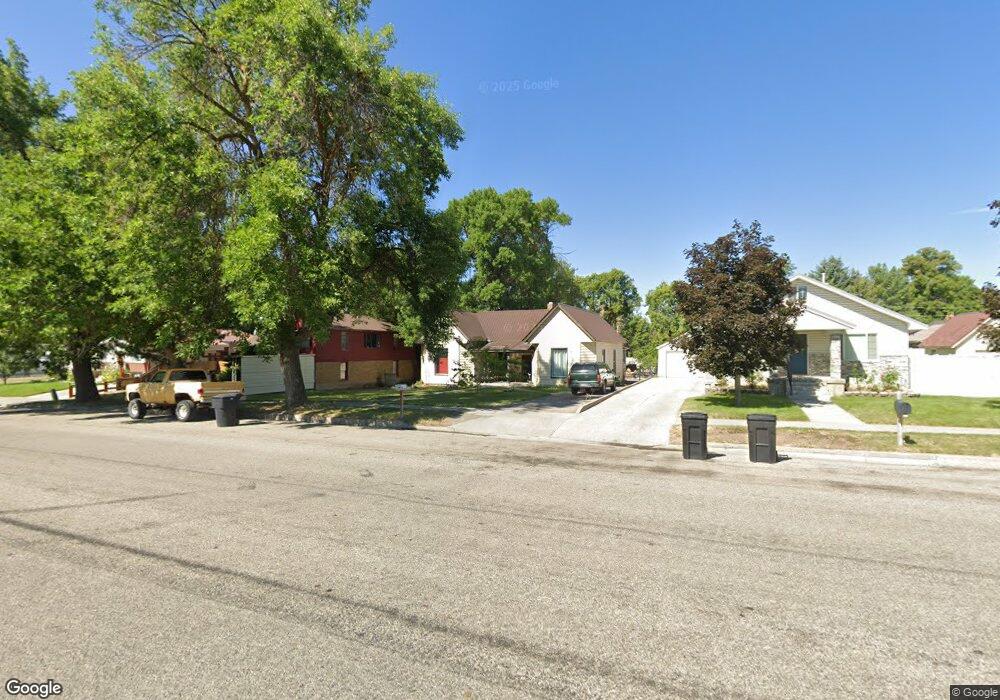
128 S 1st E Preston, ID 83263
Estimated Value: $345,000 - $399,000
3
Beds
2
Baths
1,236
Sq Ft
$296/Sq Ft
Est. Value
About This Home
This home is located at 128 S 1st E, Preston, ID 83263 and is currently estimated at $366,072, approximately $296 per square foot. 128 S 1st E is a home located in Franklin County with nearby schools including Oakwood Elementary School, Pioneer Elementary School, and Preston Junior High School.
Ownership History
Date
Name
Owned For
Owner Type
Purchase Details
Closed on
Oct 24, 2012
Sold by
Sharp William
Bought by
Porter Micheal J and Porter Natasha J
Current Estimated Value
Home Financials for this Owner
Home Financials are based on the most recent Mortgage that was taken out on this home.
Original Mortgage
$143,000
Outstanding Balance
$105,218
Interest Rate
3.5%
Mortgage Type
USDA
Estimated Equity
$260,854
Purchase Details
Closed on
Mar 7, 2012
Sold by
Federal National Mortgage Association
Bought by
Sharp William
Purchase Details
Closed on
Dec 9, 2005
Sold by
Eichhorst Barbara
Bought by
Barnett Stephen Charles and Barnett Heidi L
Home Financials for this Owner
Home Financials are based on the most recent Mortgage that was taken out on this home.
Original Mortgage
$17,600
Interest Rate
6.35%
Mortgage Type
Credit Line Revolving
Create a Home Valuation Report for This Property
The Home Valuation Report is an in-depth analysis detailing your home's value as well as a comparison with similar homes in the area
Home Values in the Area
Average Home Value in this Area
Purchase History
| Date | Buyer | Sale Price | Title Company |
|---|---|---|---|
| Porter Micheal J | -- | First American Title Company | |
| Porter Micheal J | -- | First American Title Company | |
| Sharp William | -- | First American Title | |
| Sharp William | -- | First American Title | |
| Barnett Stephen Charles | -- | -- | |
| Barnett Stephen Charles | -- | -- |
Source: Public Records
Mortgage History
| Date | Status | Borrower | Loan Amount |
|---|---|---|---|
| Open | Porter Micheal J | $143,000 | |
| Previous Owner | Barnett Stephen Charles | $17,600 | |
| Previous Owner | Barnett Stephen Charles | $70,400 |
Source: Public Records
Tax History
| Year | Tax Paid | Tax Assessment Tax Assessment Total Assessment is a certain percentage of the fair market value that is determined by local assessors to be the total taxable value of land and additions on the property. | Land | Improvement |
|---|---|---|---|---|
| 2025 | $1,399 | $309,197 | $60,000 | $249,197 |
| 2024 | $1,484 | $312,064 | $60,000 | $252,064 |
| 2023 | $1,375 | $312,064 | $60,000 | $252,064 |
| 2022 | $1,939 | $314,694 | $44,424 | $270,270 |
| 2021 | $1,505 | $248,878 | $44,424 | $204,454 |
| 2019 | $1,148 | $146,512 | $44,424 | $102,088 |
| 2018 | $1,098 | $132,705 | $30,617 | $102,088 |
| 2017 | $1,043 | $135,763 | $30,617 | $105,146 |
| 2016 | $828 | $96,657 | $30,617 | $66,040 |
| 2015 | $812 | $96,657 | $30,617 | $66,040 |
| 2014 | $15,299 | $96,657 | $30,617 | $66,040 |
| 2013 | $13,730 | $96,660 | $30,620 | $66,040 |
Source: Public Records
Map
Nearby Homes
Your Personal Tour Guide
Ask me questions while you tour the home.