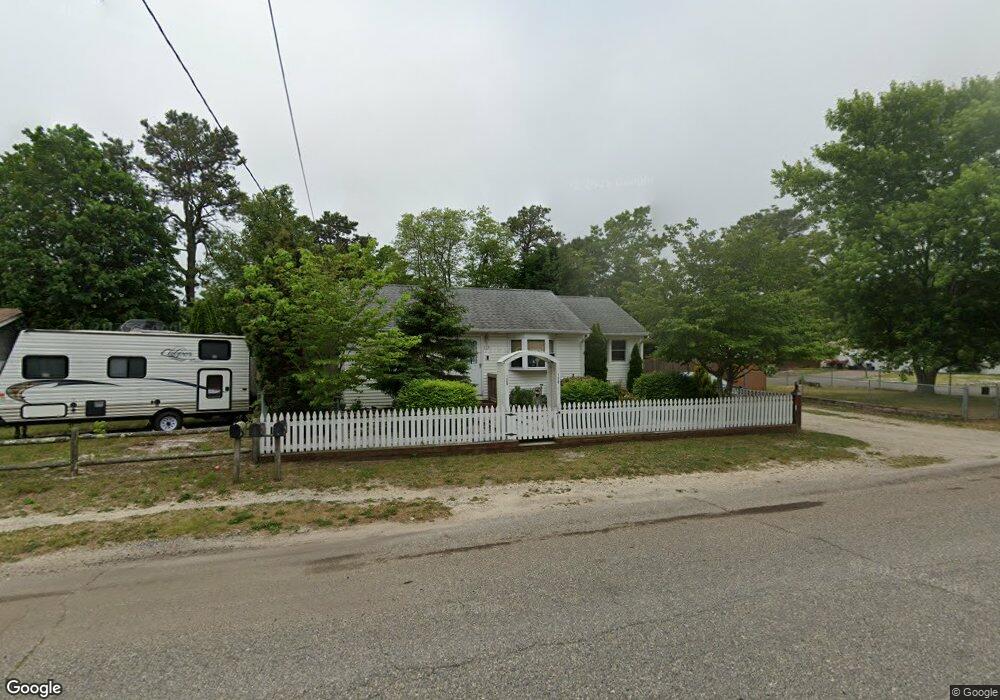
128 Seneca Blvd Barnegat, NJ 08005
Estimated Value: $287,000 - $349,000
1
Bed
1
Bath
740
Sq Ft
$435/Sq Ft
Est. Value
About This Home
This home is located at 128 Seneca Blvd, Barnegat, NJ 08005 and is currently estimated at $321,684, approximately $434 per square foot. 128 Seneca Blvd is a home located in Ocean County with nearby schools including Waretown Elementary School and Frederic A. Priff Elementary School.
Ownership History
Date
Name
Owned For
Owner Type
Purchase Details
Closed on
Jul 23, 2004
Sold by
Conroy Clara
Bought by
Conroy Clara and Conroy Mary C
Current Estimated Value
Purchase Details
Closed on
Apr 29, 2004
Sold by
Reyes Jose and Reyes Barbara
Bought by
Conroy Clara
Home Financials for this Owner
Home Financials are based on the most recent Mortgage that was taken out on this home.
Original Mortgage
$132,000
Outstanding Balance
$66,718
Interest Rate
6.62%
Mortgage Type
Fannie Mae Freddie Mac
Estimated Equity
$254,966
Purchase Details
Closed on
Feb 12, 2002
Sold by
Lange Helen Jane
Bought by
Reyes Jose and Reyes Barbara
Home Financials for this Owner
Home Financials are based on the most recent Mortgage that was taken out on this home.
Original Mortgage
$90,400
Interest Rate
7.14%
Create a Home Valuation Report for This Property
The Home Valuation Report is an in-depth analysis detailing your home's value as well as a comparison with similar homes in the area
Home Values in the Area
Average Home Value in this Area
Purchase History
| Date | Buyer | Sale Price | Title Company |
|---|---|---|---|
| Conroy Clara | -- | None Available | |
| Conroy Clara | $165,000 | First American Title Ins Co | |
| Reyes Jose | $113,000 | -- |
Source: Public Records
Mortgage History
| Date | Status | Borrower | Loan Amount |
|---|---|---|---|
| Open | Conroy Clara | $132,000 | |
| Previous Owner | Reyes Jose | $90,400 |
Source: Public Records
Tax History Compared to Growth
Tax History
| Year | Tax Paid | Tax Assessment Tax Assessment Total Assessment is a certain percentage of the fair market value that is determined by local assessors to be the total taxable value of land and additions on the property. | Land | Improvement |
|---|---|---|---|---|
| 2025 | $3,584 | $237,500 | $120,000 | $117,500 |
| 2024 | $3,378 | $237,500 | $120,000 | $117,500 |
| 2023 | $3,160 | $145,400 | $80,000 | $65,400 |
| 2022 | $3,160 | $145,400 | $80,000 | $65,400 |
| 2021 | $3,107 | $145,400 | $80,000 | $65,400 |
| 2020 | $3,066 | $145,400 | $80,000 | $65,400 |
| 2019 | $3,007 | $145,400 | $80,000 | $65,400 |
| 2018 | $2,952 | $145,400 | $80,000 | $65,400 |
| 2017 | $2,851 | $145,400 | $80,000 | $65,400 |
| 2016 | $2,770 | $145,400 | $80,000 | $65,400 |
| 2015 | $2,697 | $145,400 | $80,000 | $65,400 |
| 2014 | $2,675 | $145,400 | $80,000 | $65,400 |
Source: Public Records
Map
Nearby Homes
- 107 6th St
- 301 6th St
- 25 Baybreeze Dr
- 29 Baybreeze Dr
- 21 Baybreeze Dr
- 17 Baybreeze Dr
- 27 Baybreeze Dr
- 13 Baybreeze Dr
- 22 Baybreeze Dr
- 23 Baybreeze Dr
- 30 Baybreeze Dr
- 19 Baybreeze Dr
- 168 Beverly Dr
- 5 Pohatcong Ave
- 148 Bayshore Dr Unit A
- 34A Denville St
- 34 Denville St Unit A
- 38 Baybreeze Dr
- 34 Baybreeze Dr