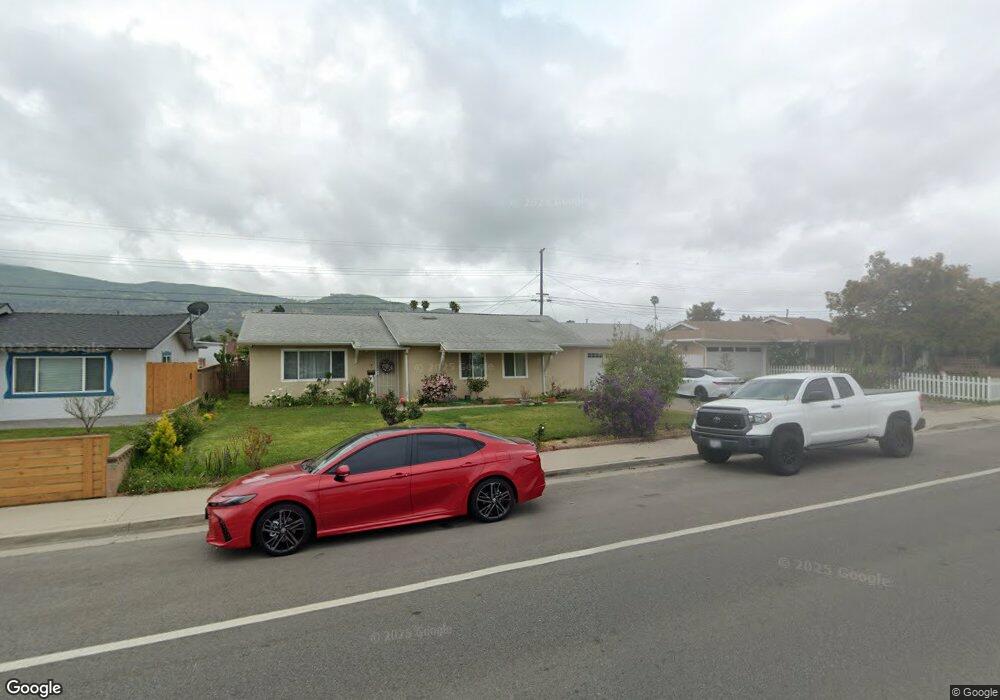
128 W Santa Paula St Santa Paula, CA 93060
Estimated Value: $594,987 - $743,000
3
Beds
2
Baths
1,071
Sq Ft
$615/Sq Ft
Est. Value
About This Home
This home is located at 128 W Santa Paula St, Santa Paula, CA 93060 and is currently estimated at $658,247, approximately $614 per square foot. 128 W Santa Paula St is a home located in Ventura County with nearby schools including McKevett Elementary School, Isbell Middle, and Santa Paula High.
Ownership History
Date
Name
Owned For
Owner Type
Purchase Details
Closed on
Jul 27, 2007
Sold by
Aguilar Isabel
Bought by
Aguilar Manuel P
Current Estimated Value
Home Financials for this Owner
Home Financials are based on the most recent Mortgage that was taken out on this home.
Original Mortgage
$265,000
Outstanding Balance
$167,785
Interest Rate
6.66%
Mortgage Type
New Conventional
Estimated Equity
$490,462
Purchase Details
Closed on
Mar 3, 2003
Sold by
Aguilar Manuel P and Perez Jose Ramon
Bought by
Aguilar Manuel P
Home Financials for this Owner
Home Financials are based on the most recent Mortgage that was taken out on this home.
Original Mortgage
$163,000
Interest Rate
5.79%
Purchase Details
Closed on
Jul 24, 1996
Sold by
Lynn Hatcher F and Lynn Ivetta J
Bought by
Aguilar Manuel P and Aguilar Jose G
Home Financials for this Owner
Home Financials are based on the most recent Mortgage that was taken out on this home.
Original Mortgage
$152,608
Interest Rate
8.42%
Mortgage Type
FHA
Create a Home Valuation Report for This Property
The Home Valuation Report is an in-depth analysis detailing your home's value as well as a comparison with similar homes in the area
Home Values in the Area
Average Home Value in this Area
Purchase History
| Date | Buyer | Sale Price | Title Company |
|---|---|---|---|
| Aguilar Manuel P | -- | Chicago Title Co 72 | |
| Aguilar Manuel P | $107,500 | American Title Co | |
| Aguilar Manuel P | $156,000 | First American Title Ins Co |
Source: Public Records
Mortgage History
| Date | Status | Borrower | Loan Amount |
|---|---|---|---|
| Open | Aguilar Manuel P | $265,000 | |
| Closed | Aguilar Manuel P | $163,000 | |
| Closed | Aguilar Manuel P | $152,608 |
Source: Public Records
Tax History Compared to Growth
Tax History
| Year | Tax Paid | Tax Assessment Tax Assessment Total Assessment is a certain percentage of the fair market value that is determined by local assessors to be the total taxable value of land and additions on the property. | Land | Improvement |
|---|---|---|---|---|
| 2025 | $8,647 | $262,089 | $104,833 | $157,256 |
| 2024 | $8,647 | $256,950 | $102,777 | $154,173 |
| 2023 | $8,585 | $251,912 | $100,762 | $151,150 |
| 2022 | $8,499 | $246,973 | $98,786 | $148,187 |
| 2021 | $8,490 | $242,131 | $96,849 | $145,282 |
| 2020 | $8,431 | $239,651 | $95,857 | $143,794 |
| 2019 | $8,279 | $234,953 | $93,978 | $140,975 |
| 2018 | $8,240 | $230,347 | $92,136 | $138,211 |
| 2017 | $2,626 | $225,831 | $90,330 | $135,501 |
| 2016 | $2,544 | $221,404 | $88,559 | $132,845 |
| 2015 | $2,434 | $218,080 | $87,230 | $130,850 |
| 2014 | $2,472 | $213,810 | $85,522 | $128,288 |
Source: Public Records
Map
Nearby Homes
- 1848 Jojoba Dr
- 413 Checkerbloom Ln
- 1856 Jojoba Dr
- 1865 Jojoba Dr
- 1941 Pomegranate St
- 455 Snowdrop Ln
- 457 Snowdrop Ln
- 275 Fuerte Dr
- 0 Dickenson Rd
- 421 N Palm Ave
- 100 E Virginia Terrace
- 107 Sonoma Ln
- 179 View Dr
- 0 View Dr Unit V1-32228
- 370 E View Dr
- 324 W Santa Barbara St
- 102 E Ventura St Unit D
- 102 E Ventura St Unit A
- 362 W Santa Barbara St
- 525 W Santa Barbara St
- 132 W Santa Paula St
- 124 W Santa Paula St
- 129 Wakeford St
- 125 Wakeford St
- 133 Wakeford St
- 120 W Santa Paula St
- 136 W Santa Paula St
- 129 W Santa Paula St
- 121 Wakeford St
- 137 Wakeford St
- 133 W Santa Paula St
- 125 W Santa Paula St
- 128 Wakeford St
- 137 W Santa Paula St
- 121 W Santa Paula St
- 124 Wakeford St
- 132 Wakeford St
- 128 Mupu St
- 141 Wakeford St
- 132 Mupu St