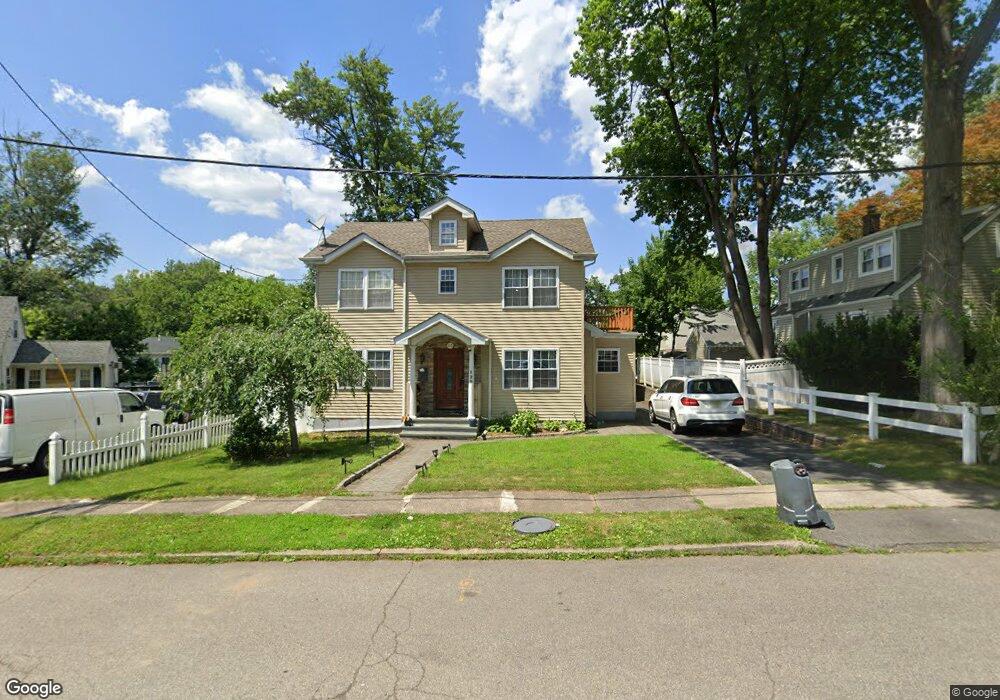
128 Walsh Dr Dumont, NJ 07628
Estimated Value: $651,000 - $691,000
4
Beds
3
Baths
1,608
Sq Ft
$418/Sq Ft
Est. Value
About This Home
This home is located at 128 Walsh Dr, Dumont, NJ 07628 and is currently estimated at $671,801, approximately $417 per square foot. 128 Walsh Dr is a home located in Bergen County with nearby schools including Dumont High School.
Ownership History
Date
Name
Owned For
Owner Type
Purchase Details
Closed on
Oct 27, 2017
Sold by
Gartner Irvin and Gartner Patricia
Bought by
Zheng Chunmei and Nie Wie
Current Estimated Value
Purchase Details
Closed on
Feb 3, 2003
Sold by
Quintero Martin
Bought by
Gartner Carlos I and Gartner Patrica
Purchase Details
Closed on
Dec 15, 1997
Sold by
Chi Peter Kuha and Chi Maria Young Sin
Bought by
Gartner Carlos I and Gartner Patricia
Home Financials for this Owner
Home Financials are based on the most recent Mortgage that was taken out on this home.
Original Mortgage
$160,100
Interest Rate
7.09%
Mortgage Type
FHA
Create a Home Valuation Report for This Property
The Home Valuation Report is an in-depth analysis detailing your home's value as well as a comparison with similar homes in the area
Home Values in the Area
Average Home Value in this Area
Purchase History
| Date | Buyer | Sale Price | Title Company |
|---|---|---|---|
| Zheng Chunmei | $440,000 | -- | |
| Gartner Carlos I | -- | -- | |
| Gartner Carlos I | $163,000 | -- |
Source: Public Records
Mortgage History
| Date | Status | Borrower | Loan Amount |
|---|---|---|---|
| Previous Owner | Gartner Carlos I | $160,100 |
Source: Public Records
Tax History
| Year | Tax Paid | Tax Assessment Tax Assessment Total Assessment is a certain percentage of the fair market value that is determined by local assessors to be the total taxable value of land and additions on the property. | Land | Improvement |
|---|---|---|---|---|
| 2025 | $11,927 | $572,100 | $291,000 | $281,100 |
| 2024 | $11,633 | $293,400 | $165,000 | $128,400 |
| 2023 | $11,393 | $293,400 | $165,000 | $128,400 |
| 2022 | $11,393 | $293,400 | $165,000 | $128,400 |
| 2021 | $11,337 | $293,400 | $165,000 | $128,400 |
| 2020 | $11,029 | $293,400 | $165,000 | $128,400 |
| 2019 | $10,765 | $293,400 | $165,000 | $128,400 |
| 2018 | $10,545 | $293,400 | $165,000 | $128,400 |
| 2017 | $10,342 | $293,400 | $165,000 | $128,400 |
| 2016 | $10,102 | $293,400 | $165,000 | $128,400 |
| 2015 | $9,870 | $293,400 | $165,000 | $128,400 |
| 2014 | $9,676 | $293,400 | $165,000 | $128,400 |
Source: Public Records
Map
Nearby Homes
- 7 Overlook Dr
- 116 Lexington Ave
- 79 Blauvelt Ave
- 292 Magnolia Ave
- 136 Elm St
- 15 Dunn Place
- 112 Oxford Place
- 42 Lenox Ave
- 40 Depew St
- 206 10th St
- 15 Pleasant St
- 119 Stonegate Trail
- 136 Stonegate Trail Unit 37
- 181 Phelps Ave
- 110 New York Ave
- 168 4th St
- 74 Shadyside Ave
- 95 W Shore Ave
- 19 Bedford Rd
- 137 6th St
Your Personal Tour Guide
Ask me questions while you tour the home.