
Seller's Agent in 2026
Deb Forte
Century 21 North East
(978) 423-6464
4 in this area
197 Total Sales
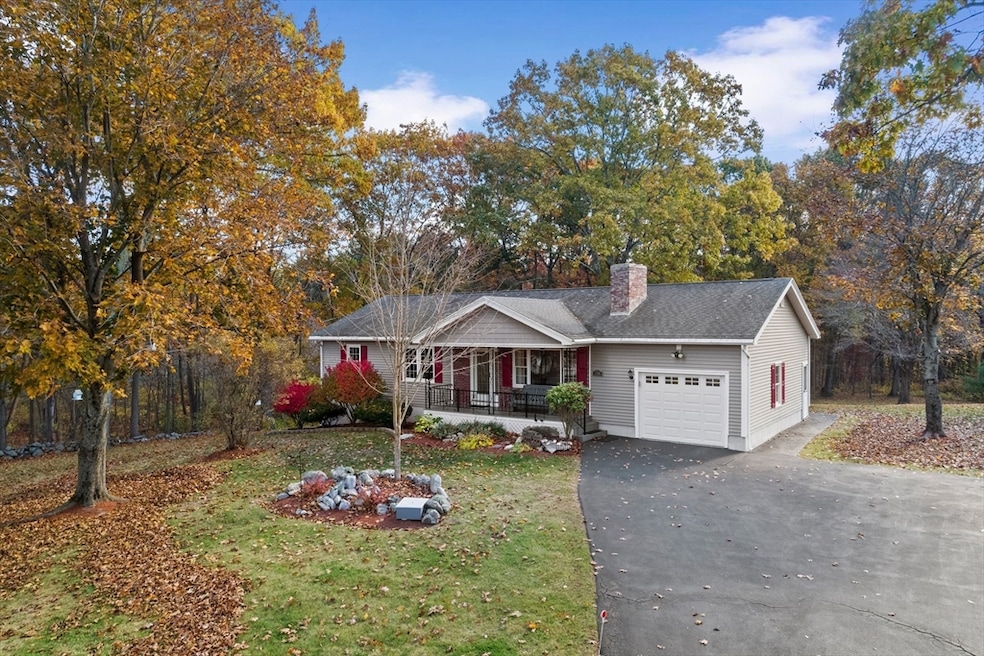
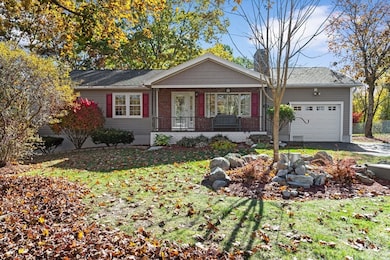
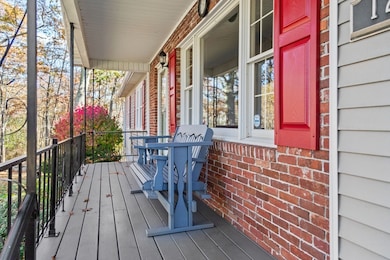
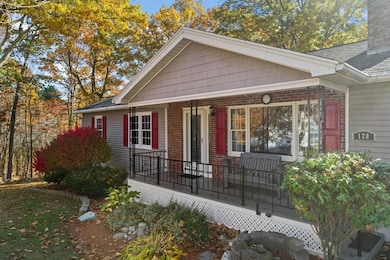
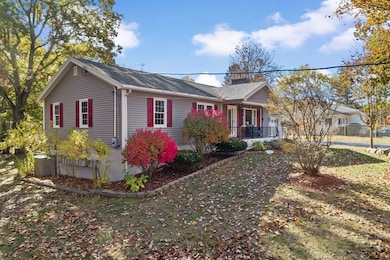
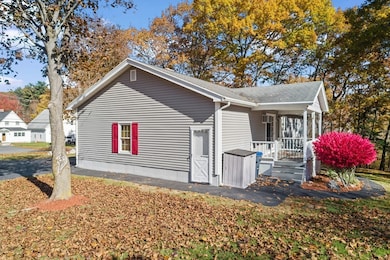
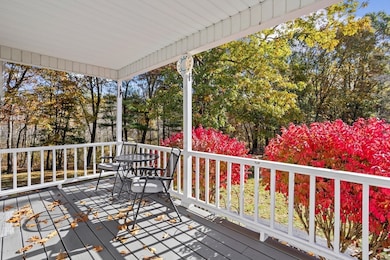
Opportunity is now in West Methuen! Sited on an oversized .92-acre lot. Set beautifully on a lot with a large backyard for total privacy, on a country road. One-owner custom-built oversized ranch with attached garage set back on over an acre with a private, peaceful backyard. Lovingly cared for and move-in ready, this spotless home features three bedrooms, one full bath, a kitchen, dining room, and a comfortable living room. Appliances are in excellent condition. The full WALKOUT basement offers a workshop and two partially finished rooms—perfect for a playroom, office, or hobby space. End your days on the covered back or front porch. Pride of ownership throughout! Don’t miss this beautiful home—it won’t last! - Due to the amount of interest, OFFERS are due by Tuesday, 11-4-2025, by 3 pm
| Date | Type | Sale Price | Title Company |
|---|---|---|---|
| Quit Claim Deed | $650,000 | -- | |
| Quit Claim Deed | -- | -- | |
| Quit Claim Deed | -- | -- | |
| Quit Claim Deed | -- | -- | |
| Quit Claim Deed | -- | -- | |
| Quit Claim Deed | -- | -- | |
| Deed | -- | -- |
| Date | Status | Loan Amount | Loan Type |
|---|---|---|---|
| Open | $200,000 | New Conventional | |
| Previous Owner | $20,000 | No Value Available |
| Date | Event | Price | List to Sale | Price per Sq Ft |
|---|---|---|---|---|
| 01/07/2026 01/07/26 | Sold | $650,000 | 0.0% | $371 / Sq Ft |
| 11/21/2025 11/21/25 | Pending | -- | -- | -- |
| 11/14/2025 11/14/25 | For Sale | $650,000 | 0.0% | $371 / Sq Ft |
| 11/06/2025 11/06/25 | Pending | -- | -- | -- |
| 10/30/2025 10/30/25 | For Sale | $650,000 | -- | $371 / Sq Ft |
| Year | Tax Paid | Tax Assessment Tax Assessment Total Assessment is a certain percentage of the fair market value that is determined by local assessors to be the total taxable value of land and additions on the property. | Land | Improvement |
|---|---|---|---|---|
| 2025 | $6,348 | $600,000 | $296,800 | $303,200 |
| 2024 | $6,315 | $581,500 | $270,800 | $310,700 |
| 2023 | $5,986 | $511,600 | $240,700 | $270,900 |
| 2022 | $5,730 | $439,100 | $200,600 | $238,500 |
| 2021 | $5,382 | $408,000 | $190,500 | $217,500 |
| 2020 | $5,375 | $399,900 | $190,500 | $209,400 |
| 2019 | $5,079 | $357,900 | $170,500 | $187,400 |
| 2018 | $4,966 | $348,000 | $170,500 | $177,500 |
| 2017 | $4,830 | $329,700 | $170,500 | $159,200 |
| 2016 | $4,610 | $311,300 | $160,400 | $150,900 |
| 2015 | $4,431 | $303,500 | $160,400 | $143,100 |
Seller's Agent in 2026
Deb Forte
Century 21 North East
(978) 423-6464
4 in this area
197 Total Sales
Buyer's Agent in 2026
Michelle Fermin
Century 21 North East
(978) 423-6545
24 in this area
1,125 Total Sales
Source: MLS Property Information Network (MLS PIN)
MLS Number: 73449384
APN: 114-129A-19A
Disclaimer: Certain information contained herein is derived from information provided by parties other than Homes.com. All information provided is deemed reliable, but is not guaranteed to be accurate and should be independently verified.
![]() The property listing data and information, or the Images, set forth herein were provided to MLS Property Information Network, Inc. from third party sources, including sellers, lessors and public records, and were compiled by MLS Property Information Network, Inc. The property listing data and information, and the Images, are for the personal, non-commercial use of consumers having a good faith interest in purchasing or leasing listed properties of the type displayed to them and may not be used for any purpose other than to identify prospective properties which such consumers may have a good faith interest in purchasing or leasing. MLS Property Information Network, Inc. and its subscribers disclaim any and all representations and warranties as to the accuracy of the property listing data and information, or as to the accuracy of any of the Images, set forth herein.
The property listing data and information, or the Images, set forth herein were provided to MLS Property Information Network, Inc. from third party sources, including sellers, lessors and public records, and were compiled by MLS Property Information Network, Inc. The property listing data and information, and the Images, are for the personal, non-commercial use of consumers having a good faith interest in purchasing or leasing listed properties of the type displayed to them and may not be used for any purpose other than to identify prospective properties which such consumers may have a good faith interest in purchasing or leasing. MLS Property Information Network, Inc. and its subscribers disclaim any and all representations and warranties as to the accuracy of the property listing data and information, or as to the accuracy of any of the Images, set forth herein.
Ask me questions while you tour the home.