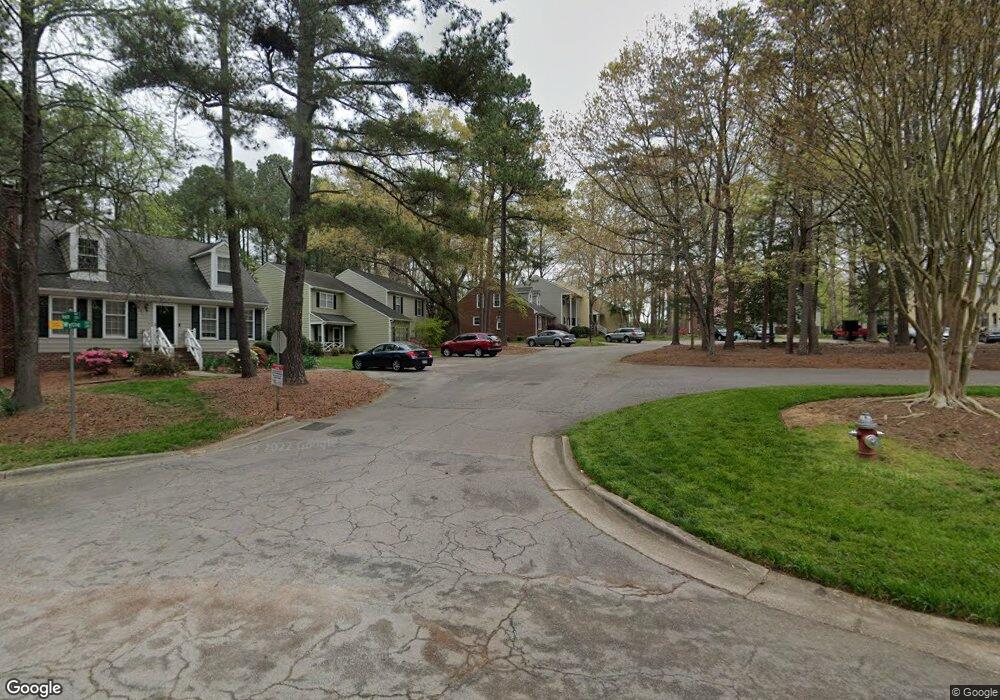
128 Wythe Cir Raleigh, NC 27615
Six Forks NeighborhoodEstimated Value: $303,348 - $317,000
3
Beds
2
Baths
1,600
Sq Ft
$192/Sq Ft
Est. Value
About This Home
This home is located at 128 Wythe Cir, Raleigh, NC 27615 and is currently estimated at $307,587, approximately $192 per square foot. 128 Wythe Cir is a home located in Wake County with nearby schools including North Ridge Elementary School, West Millbrook Middle School, and Sanderson High School.
Ownership History
Date
Name
Owned For
Owner Type
Purchase Details
Closed on
Jan 21, 2011
Sold by
Parker Edward R and Kokoszka Angelica Stefania
Bought by
Parker Edward R and Kokoszka Angelica Stefania
Current Estimated Value
Home Financials for this Owner
Home Financials are based on the most recent Mortgage that was taken out on this home.
Original Mortgage
$131,500
Outstanding Balance
$4,062
Interest Rate
4.79%
Mortgage Type
New Conventional
Estimated Equity
$303,525
Purchase Details
Closed on
Aug 18, 2006
Sold by
Taylor Sarah C and Taylor Matthew R
Bought by
Parker Edward R
Home Financials for this Owner
Home Financials are based on the most recent Mortgage that was taken out on this home.
Original Mortgage
$139,900
Interest Rate
6.67%
Mortgage Type
Unknown
Purchase Details
Closed on
Jun 13, 2002
Sold by
Beth Meyer Synagogue Inc
Bought by
Kandefer Sarah C
Home Financials for this Owner
Home Financials are based on the most recent Mortgage that was taken out on this home.
Original Mortgage
$99,920
Interest Rate
5.87%
Create a Home Valuation Report for This Property
The Home Valuation Report is an in-depth analysis detailing your home's value as well as a comparison with similar homes in the area
Home Values in the Area
Average Home Value in this Area
Purchase History
| Date | Buyer | Sale Price | Title Company |
|---|---|---|---|
| Parker Edward R | -- | None Available | |
| Parker Edward R | $140,000 | None Available | |
| Kandefer Sarah C | $125,000 | -- |
Source: Public Records
Mortgage History
| Date | Status | Borrower | Loan Amount |
|---|---|---|---|
| Open | Parker Edward R | $131,500 | |
| Closed | Parker Edward R | $139,900 | |
| Previous Owner | Kandefer Sarah C | $99,920 | |
| Closed | Kandefer Sarah C | $18,735 |
Source: Public Records
Tax History Compared to Growth
Tax History
| Year | Tax Paid | Tax Assessment Tax Assessment Total Assessment is a certain percentage of the fair market value that is determined by local assessors to be the total taxable value of land and additions on the property. | Land | Improvement |
|---|---|---|---|---|
| 2025 | $2,668 | $303,688 | $50,000 | $253,688 |
| 2024 | $2,658 | $303,688 | $50,000 | $253,688 |
| 2023 | $1,920 | $174,274 | $32,000 | $142,274 |
| 2022 | $1,785 | $174,274 | $32,000 | $142,274 |
| 2021 | $1,716 | $174,274 | $32,000 | $142,274 |
| 2020 | $1,685 | $174,274 | $32,000 | $142,274 |
| 2019 | $1,383 | $117,616 | $25,000 | $92,616 |
| 2018 | $1,305 | $117,616 | $25,000 | $92,616 |
| 2017 | $1,244 | $117,616 | $25,000 | $92,616 |
| 2016 | $1,218 | $117,616 | $25,000 | $92,616 |
| 2015 | $1,378 | $131,125 | $24,000 | $107,125 |
| 2014 | $1,307 | $131,125 | $24,000 | $107,125 |
Source: Public Records
Map
Nearby Homes
- 204 Bracken Ct
- 213 Bracken Ct
- 232 Wetherburn Ln
- 7412 Penny Hill Ln
- 7320 Sandy Creek Dr
- 7719 Kelley Ct Unit 314E
- 7729 Bernadette Ln Unit 322B
- 800 Plentywood Ct
- 812 Havenwood Ct
- 7046 Longstreet Dr Unit C
- 7020 Longstreet Dr Unit A
- 6917 Justice Dr
- 7124 Longstreet Dr
- 7002 Longstreet Dr Unit C
- 7108 Longstreet Dr Unit A
- 7329 Bonnie Ridge Ct
- 8009 Running Cedar Trail
- 7715 Kingsberry Ct
- 7731 Kingsberry Ct
- 8112 Running Cedar Trail