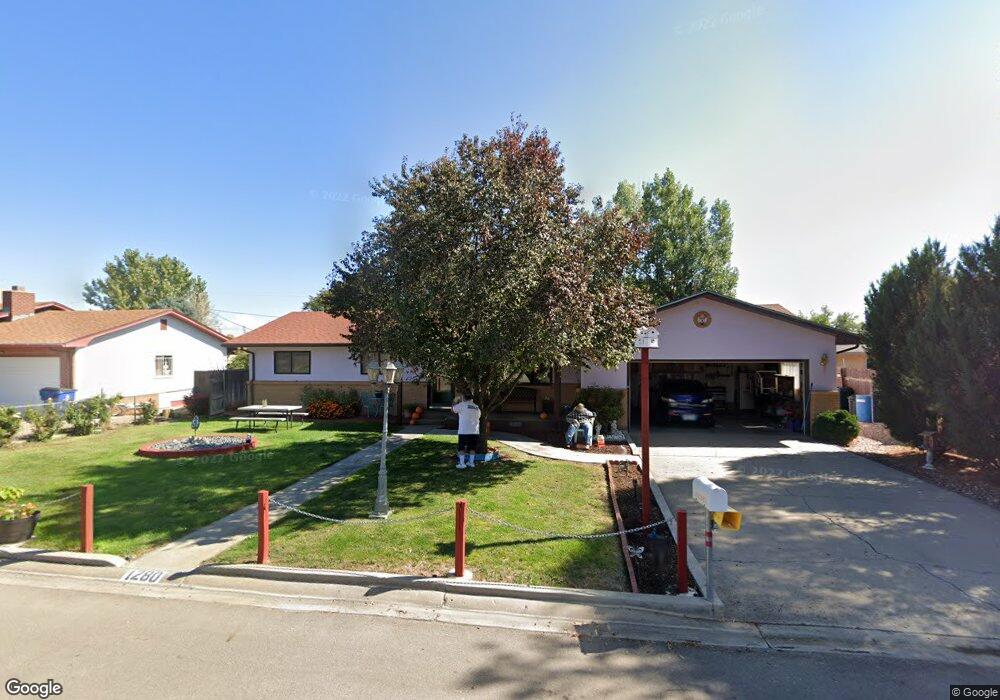
1280 20 1 2 Ln Pueblo, CO 81006
Estimated Value: $237,216 - $360,000
3
Beds
2
Baths
1,430
Sq Ft
$208/Sq Ft
Est. Value
About This Home
This home is located at 1280 20 1 2 Ln, Pueblo, CO 81006 and is currently estimated at $296,804, approximately $207 per square foot. 1280 20 1 2 Ln is a home located in Pueblo County with nearby schools including South Mesa Elementary School, Pleasant View Middle School, and Pueblo County High School.
Ownership History
Date
Name
Owned For
Owner Type
Purchase Details
Closed on
Oct 28, 2003
Sold by
Zimmerman Dave + Diane
Bought by
Valdez Jerry William
Current Estimated Value
Purchase Details
Closed on
May 31, 1995
Sold by
Marsh James D + Eldonna L
Bought by
Zimmerman Dave + Diane
Purchase Details
Closed on
Oct 3, 1989
Sold by
Cordova Agustin E
Bought by
Marsh James D + Eldonna L
Purchase Details
Closed on
Oct 19, 1987
Sold by
Brewer Herbert G + Rosie R
Bought by
Cordova Agustin E
Purchase Details
Closed on
Jan 4, 1982
Sold by
Stockman Donald J + Corrine
Bought by
Brewer Herbert G+Rosie R
Purchase Details
Closed on
Dec 24, 1980
Sold by
Highline Nancy E
Bought by
Stockman Donald J+Corrine
Purchase Details
Closed on
Dec 27, 1977
Sold by
Highline Cecil L + Nancy E
Bought by
Highline Nancy E
Purchase Details
Closed on
Apr 9, 1976
Bought by
Highline Cecil L + Nancy E
Create a Home Valuation Report for This Property
The Home Valuation Report is an in-depth analysis detailing your home's value as well as a comparison with similar homes in the area
Home Values in the Area
Average Home Value in this Area
Purchase History
| Date | Buyer | Sale Price | Title Company |
|---|---|---|---|
| Valdez Jerry William | $124,000 | -- | |
| Zimmerman Dave + Diane | $77,000 | -- | |
| Marsh James D + Eldonna L | $59,500 | -- | |
| Cordova Agustin E | $53,900 | -- | |
| Brewer Herbert G+Rosie R | $53,900 | -- | |
| Stockman Donald J+Corrine | $46,500 | -- | |
| Highline Nancy E | -- | -- | |
| Highline Cecil L + Nancy E | $35,000 | -- |
Source: Public Records
Tax History Compared to Growth
Tax History
| Year | Tax Paid | Tax Assessment Tax Assessment Total Assessment is a certain percentage of the fair market value that is determined by local assessors to be the total taxable value of land and additions on the property. | Land | Improvement |
|---|---|---|---|---|
| 2024 | $752 | $13,700 | -- | -- |
| 2023 | $760 | $17,390 | $1,690 | $15,700 |
| 2022 | $751 | $13,970 | $1,750 | $12,220 |
| 2021 | $784 | $14,370 | $1,800 | $12,570 |
| 2020 | $650 | $12,120 | $1,070 | $11,050 |
| 2019 | $639 | $11,962 | $1,073 | $10,889 |
| 2018 | $549 | $10,283 | $1,080 | $9,203 |
| 2017 | $562 | $10,283 | $1,080 | $9,203 |
| 2016 | $540 | $9,910 | $1,194 | $8,716 |
| 2015 | $487 | $9,910 | $1,194 | $8,716 |
| 2014 | $487 | $8,984 | $1,194 | $7,790 |
Source: Public Records
Map
Nearby Homes
- 1953 South Rd
- 1002 Frontier St
- 1345 Terry Cir
- 990 23rd Ln
- Lot 13 Fallview Dr
- TBD US Hwy 50
- 1131 24 1 2 Ln
- 2291 Chantala Ave
- 1431 Tampico
- 1143 25th Ln
- 24484 Gale Rd
- 2233 Daniel Rd
- TBD Santa fe Dr
- 931 25th Ln
- 23401 Shylo Dr
- 1725 Harlow Ave
- 24928 Birdsong Dr
- 27193 County Farm Rd
- 27111 Preston Rd
- 26680 Everett Rd