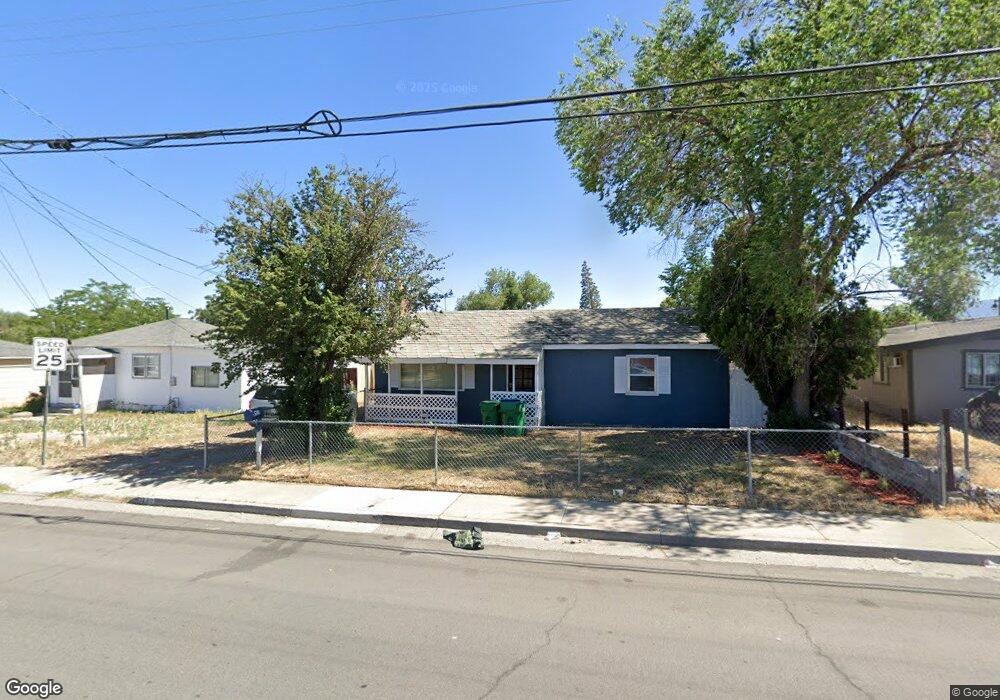
1280 Oliver St Reno, NV 89512
Northeast Reno NeighborhoodEstimated Value: $318,000 - $375,000
2
Beds
1
Bath
960
Sq Ft
$355/Sq Ft
Est. Value
About This Home
This home is located at 1280 Oliver St, Reno, NV 89512 and is currently estimated at $341,103, approximately $355 per square foot. 1280 Oliver St is a home located in Washoe County with nearby schools including Rita Cannan Elementary School, Fred W. Traner Middle School, and Procter R. Hug High School.
Ownership History
Date
Name
Owned For
Owner Type
Purchase Details
Closed on
Mar 21, 2008
Sold by
Deutsche Bank National Trust Co
Bought by
Joseph Michael and Joseph Anthia Deborah
Current Estimated Value
Home Financials for this Owner
Home Financials are based on the most recent Mortgage that was taken out on this home.
Original Mortgage
$128,877
Outstanding Balance
$79,900
Interest Rate
5.65%
Mortgage Type
FHA
Estimated Equity
$261,203
Purchase Details
Closed on
Jul 18, 2007
Sold by
Hughes Edwina A
Bought by
Deutsche Bank National Trust Co and Argent Mortgage Securities Inc Asset Bac
Purchase Details
Closed on
Jun 19, 2001
Sold by
Herman Judy Pruett and Pruett Judy Dee
Bought by
Hughes Edwina A
Home Financials for this Owner
Home Financials are based on the most recent Mortgage that was taken out on this home.
Original Mortgage
$77,309
Interest Rate
7.15%
Mortgage Type
FHA
Create a Home Valuation Report for This Property
The Home Valuation Report is an in-depth analysis detailing your home's value as well as a comparison with similar homes in the area
Home Values in the Area
Average Home Value in this Area
Purchase History
| Date | Buyer | Sale Price | Title Company |
|---|---|---|---|
| Joseph Michael | $131,000 | Western Title Inc Ridge | |
| Deutsche Bank National Trust Co | $173,000 | Accommodation | |
| Hughes Edwina A | $78,000 | First Centennial Title Co | |
| Herman Judy Pruett | -- | First Centennial Title Co |
Source: Public Records
Mortgage History
| Date | Status | Borrower | Loan Amount |
|---|---|---|---|
| Open | Joseph Michael | $128,877 | |
| Previous Owner | Hughes Edwina A | $77,309 |
Source: Public Records
Tax History Compared to Growth
Tax History
| Year | Tax Paid | Tax Assessment Tax Assessment Total Assessment is a certain percentage of the fair market value that is determined by local assessors to be the total taxable value of land and additions on the property. | Land | Improvement |
|---|---|---|---|---|
| 2025 | $538 | $40,134 | $25,641 | $14,493 |
| 2024 | $538 | $36,997 | $22,712 | $14,285 |
| 2023 | $505 | $37,682 | $24,917 | $12,766 |
| 2022 | $491 | $30,045 | $19,719 | $10,326 |
| 2021 | $470 | $23,402 | $13,451 | $9,951 |
| 2020 | $455 | $22,500 | $12,726 | $9,774 |
| 2019 | $442 | $21,997 | $12,695 | $9,302 |
| 2018 | $430 | $17,589 | $8,678 | $8,911 |
| 2017 | $418 | $16,259 | $7,515 | $8,744 |
| 2016 | $407 | $15,482 | $6,717 | $8,765 |
| 2015 | $407 | $13,212 | $4,622 | $8,590 |
| 2014 | $395 | $11,892 | $3,791 | $8,101 |
| 2013 | -- | $10,353 | $2,489 | $7,864 |
Source: Public Records
Map
Nearby Homes
- 1895 Citron St
- 1680 Sutro St
- 1925 Citron St
- 1955 Wilder St
- 1868 Fife Dr
- 2424 Sutro St
- 1525 Carville Dr
- 1855 Mccloud Ave
- 2085 Highview Ct Unit 1
- 2085 Highview Ct Unit 2
- 2090 Highview Ct Unit 7
- 2355 Tripp Dr Unit 7
- 2065 Wedekind Rd
- 1365 E 11th St
- 1885 Castle Way
- 2375 Tripp Dr Unit 11
- 2375 Tripp Dr Unit 9
- 1775 Carville Dr
- 1990 Trainer Way
- 2101 Highview Ct Unit 9
- 1260 Oliver St
- 1290 Oliver St
- 1290 Oliver Ave
- 1298 Oliver Ave
- 1240 Oliver Ave
- 1298 Oliver St
- 1240 Oliver St
- 1800 Wilder St
- 1295 Oliver Ave
- 1810 Wilder St
- 1300 Oliver St
- 1285 Trainer Way
- 1265 Trainer Way
- 1300 Oliver Ave
- 1815 Citron St
- 1305 Trainer Way
- 1225 Oliver St
- 1245 Trainer Way
- 1325 Trainer Way
- 1225 Trainer Way