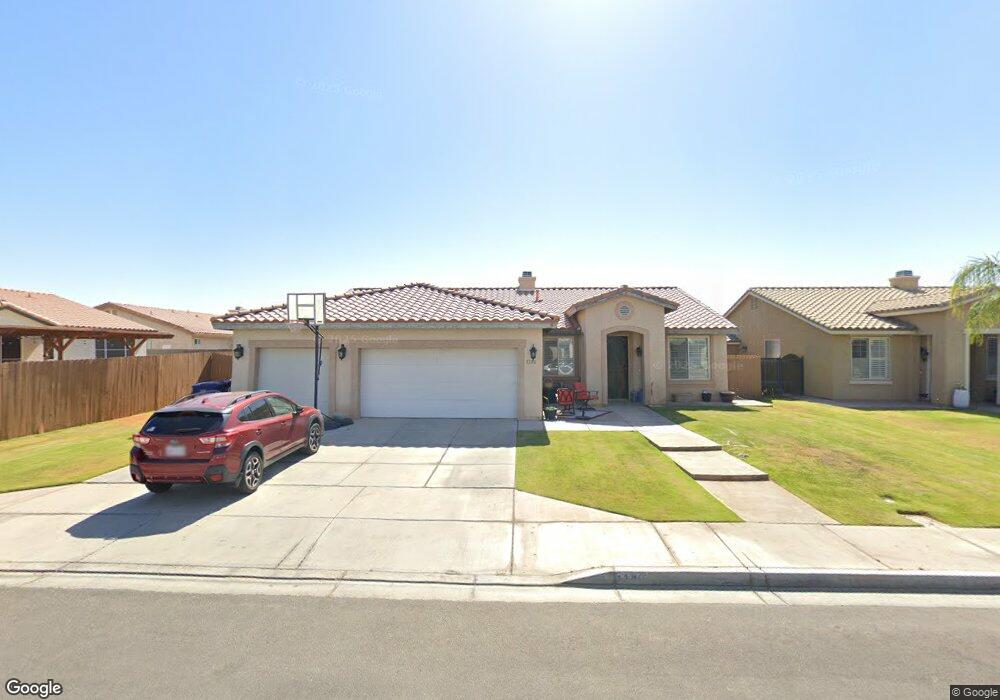
1280 Peridot Ct Calexico, CA 92231
Estimated Value: $474,005 - $566,000
4
Beds
2
Baths
2,293
Sq Ft
$227/Sq Ft
Est. Value
About This Home
This home is located at 1280 Peridot Ct, Calexico, CA 92231 and is currently estimated at $521,251, approximately $227 per square foot. 1280 Peridot Ct is a home located in Imperial County with nearby schools including Cesar Chavez Elementary School, Enrique Camarena Junior High School, and Calexico High School.
Ownership History
Date
Name
Owned For
Owner Type
Purchase Details
Closed on
Mar 8, 2016
Sold by
Pesl Tracy L
Bought by
Pesl Rosemary A and Pesl Gene G
Current Estimated Value
Purchase Details
Closed on
Aug 11, 2003
Sold by
El Dorado Residential Investors Llc
Bought by
Pesl Tracy L
Home Financials for this Owner
Home Financials are based on the most recent Mortgage that was taken out on this home.
Original Mortgage
$165,500
Interest Rate
6.27%
Mortgage Type
Purchase Money Mortgage
Purchase Details
Closed on
Feb 26, 2003
Sold by
Lprop Ostrich Llc
Bought by
El Dorado Residential Investors Llc
Home Financials for this Owner
Home Financials are based on the most recent Mortgage that was taken out on this home.
Original Mortgage
$1,105,000
Interest Rate
5.83%
Mortgage Type
Construction
Create a Home Valuation Report for This Property
The Home Valuation Report is an in-depth analysis detailing your home's value as well as a comparison with similar homes in the area
Purchase History
| Date | Buyer | Sale Price | Title Company |
|---|---|---|---|
| Pesl Rosemary A | -- | None Available | |
| Pesl Tracy L | $207,000 | First American Title Co | |
| El Dorado Residential Investors Llc | -- | First American Title |
Source: Public Records
Mortgage History
| Date | Status | Borrower | Loan Amount |
|---|---|---|---|
| Previous Owner | Pesl Tracy L | $165,500 | |
| Previous Owner | El Dorado Residential Investors Llc | $1,105,000 |
Source: Public Records
Tax History
| Year | Tax Paid | Tax Assessment Tax Assessment Total Assessment is a certain percentage of the fair market value that is determined by local assessors to be the total taxable value of land and additions on the property. | Land | Improvement |
|---|---|---|---|---|
| 2025 | $3,785 | $311,804 | $41,429 | $270,375 |
| 2023 | $3,785 | $299,698 | $39,821 | $259,877 |
| 2022 | $3,666 | $293,823 | $39,041 | $254,782 |
| 2021 | $3,558 | $288,063 | $38,276 | $249,787 |
| 2020 | $3,426 | $285,110 | $37,884 | $247,226 |
| 2019 | $3,327 | $279,521 | $37,142 | $242,379 |
| 2018 | $3,297 | $274,041 | $36,414 | $237,627 |
| 2017 | $3,058 | $268,668 | $35,700 | $232,968 |
| 2016 | $2,836 | $263,075 | $42,031 | $221,044 |
| 2015 | $2,685 | $250,000 | $40,000 | $210,000 |
| 2014 | $2,108 | $198,447 | $40,000 | $158,447 |
Source: Public Records
Map
Nearby Homes
- 1113 Camilia St
- 1179 Cabana St
- 1160 Rosas St Unit 152
- 1900 Rancho Frontera Ave Unit D25
- 1900 Rancho Frontera Ave Unit H59
- 1000 E Cole Rd
- 0 E Cole Rd Unit Lot 1 250029524
- 1237 D Hinojosa St
- 950 Santa Ana St
- 705 Harlan Ct
- 0 Avenida de Oro
- 816 Beach Ave
- 1245 C N Perry Rd
- 1213 C N Perry Rd
- 248 Hernandez St
- 0 California 98
- 1070 Heber Ave
- 1061 Heber Ave
- 817 E 6th St
- 1036 Playa Del Norte
- 1276 Peridot Ct
- 1236 Turquoise St
- 1240 Turquoise St
- 1263 Agate Ct
- 1259 Agate Ct
- 1272 Peridot Ct
- 1244 Turquoise St
- 1281 Peridot Ct
- 1228 Turquoise St
- 1277 Peridot Ct
- 1255 Agate Ct
- 1248 Turquoise St
- 1273 Peridot Ct
- 1268 Peridot Ct
- 1224 Turquoise St
- 1251 Agate Ct
- 1237 Turquoise St
- 1233 Turquoise St
- 1252 Turquoise St
- 1264 Agate Ct
Your Personal Tour Guide
Ask me questions while you tour the home.