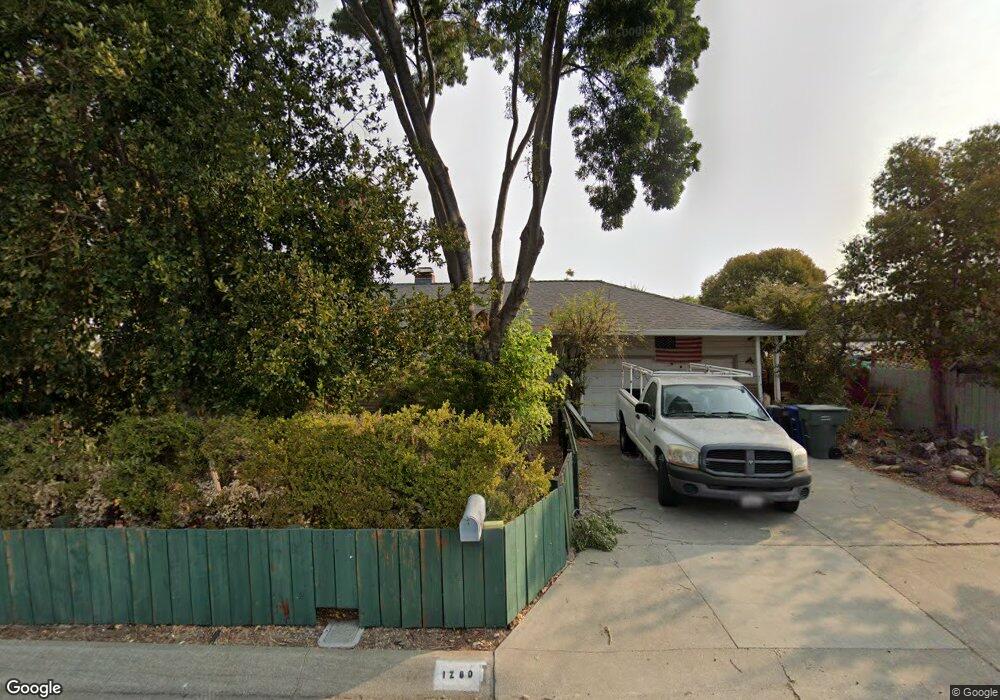
1280 Traynor Rd Concord, CA 94520
Monument Corridor NeighborhoodEstimated Value: $617,000 - $670,040
3
Beds
1
Bath
1,024
Sq Ft
$622/Sq Ft
Est. Value
About This Home
This home is located at 1280 Traynor Rd, Concord, CA 94520 and is currently estimated at $636,760, approximately $621 per square foot. 1280 Traynor Rd is a home located in Contra Costa County with nearby schools including Meadow Homes Elementary School, Oak Grove Middle School, and Mt. Diablo High School.
Ownership History
Date
Name
Owned For
Owner Type
Purchase Details
Closed on
Aug 29, 2012
Sold by
Deckman Alice
Bought by
Deckman Alice A
Current Estimated Value
Home Financials for this Owner
Home Financials are based on the most recent Mortgage that was taken out on this home.
Original Mortgage
$115,000
Interest Rate
3.35%
Mortgage Type
New Conventional
Purchase Details
Closed on
Oct 31, 2000
Sold by
Adele Deckman Alice
Bought by
Deckman Alice A
Purchase Details
Closed on
May 21, 1999
Sold by
Demello Caroline E and Demello Patricia Ainsworth
Bought by
Deckman Alice Adele
Home Financials for this Owner
Home Financials are based on the most recent Mortgage that was taken out on this home.
Original Mortgage
$116,000
Interest Rate
6.9%
Mortgage Type
Purchase Money Mortgage
Create a Home Valuation Report for This Property
The Home Valuation Report is an in-depth analysis detailing your home's value as well as a comparison with similar homes in the area
Home Values in the Area
Average Home Value in this Area
Purchase History
| Date | Buyer | Sale Price | Title Company |
|---|---|---|---|
| Deckman Alice A | -- | Old Republic Title Company | |
| Deckman Alice | -- | Old Republic Title Company | |
| Deckman Alice A | -- | -- | |
| Deckman Alice Adele | $145,000 | Fidelity National Title Co |
Source: Public Records
Mortgage History
| Date | Status | Borrower | Loan Amount |
|---|---|---|---|
| Previous Owner | Deckman Alice | $115,000 | |
| Previous Owner | Deckman Alice Adele | $116,000 |
Source: Public Records
Tax History Compared to Growth
Tax History
| Year | Tax Paid | Tax Assessment Tax Assessment Total Assessment is a certain percentage of the fair market value that is determined by local assessors to be the total taxable value of land and additions on the property. | Land | Improvement |
|---|---|---|---|---|
| 2025 | $7,646 | $619,038 | $499,392 | $119,646 |
| 2024 | $7,502 | $606,900 | $489,600 | $117,300 |
| 2023 | $7,502 | $595,000 | $480,000 | $115,000 |
| 2022 | $3,271 | $214,185 | $110,785 | $103,400 |
| 2021 | $3,176 | $209,986 | $108,613 | $101,373 |
| 2019 | $3,103 | $203,760 | $105,393 | $98,367 |
| 2018 | $2,977 | $199,766 | $103,327 | $96,439 |
| 2017 | $2,865 | $195,850 | $101,301 | $94,549 |
| 2016 | $2,764 | $192,011 | $99,315 | $92,696 |
| 2015 | $2,707 | $189,128 | $97,824 | $91,304 |
| 2014 | $2,636 | $185,424 | $95,908 | $89,516 |
Source: Public Records
Map
Nearby Homes
- 1990 Sunshine Dr
- 1241 Pine Creek Way Unit F
- 1865 Premier Place
- 2398 Walters Way Unit 6
- 2361 Bedford Rd
- 1133 Meadow Ln Unit 103
- 1133 Meadow Ln Unit 53
- 2450 Walters Way Unit 2
- 2450 Walters Way Unit 11
- 1560 Pine St Unit 8
- 1439 Toyon Dr
- 1600 Laguna St Unit C
- 2000 Laguna Cir Unit D
- 1520 Detroit Ave
- 1286 Redwood Dr
- 2100 Laguna Cir Unit D
- 2525 Walters Way Unit 19
- 2525 Walters Way Unit 22
- 1660 Jenkinson Dr
- 1750 Diane Ct
- 1290 Traynor Rd
- 2065 Leland Way
- 2075 Leland Way
- 1300 Traynor Rd
- 1281 Traynor Rd
- 1271 Traynor Rd
- 1301 Lexington Rd
- 1291 Traynor Rd
- 1310 Traynor Rd
- 2070 Leland Way
- 2031 Leland Way
- 1301 Traynor Rd
- 2060 Leland Way
- 2080 Leland Way
- 2050 Leland Way
- 1311 Traynor Rd
- 1320 Traynor Rd
- 2090 Leland Way
- 2040 Leland Way
- 2021 Leland Way