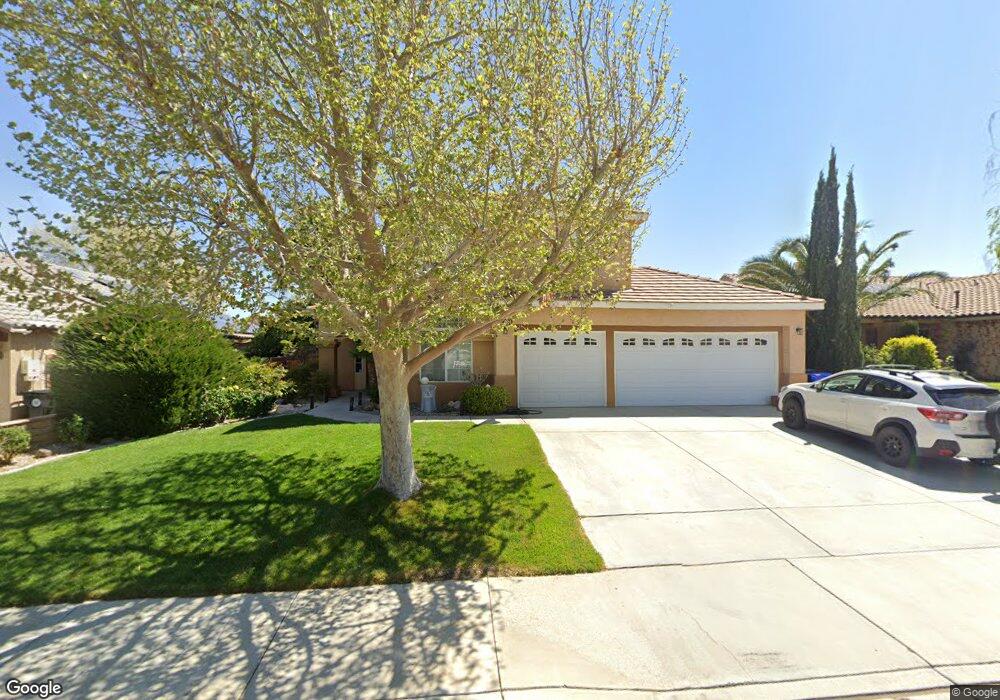
12801 Cimarron Way Victorville, CA 92392
Mesa Linda NeighborhoodEstimated Value: $473,000 - $513,000
4
Beds
3
Baths
2,299
Sq Ft
$214/Sq Ft
Est. Value
About This Home
This home is located at 12801 Cimarron Way, Victorville, CA 92392 and is currently estimated at $491,158, approximately $213 per square foot. 12801 Cimarron Way is a home located in San Bernardino County with nearby schools including Eagle Ranch Elementary School, Silverado High School, and Mojave River Academy - Oro Grande.
Ownership History
Date
Name
Owned For
Owner Type
Purchase Details
Closed on
Jun 16, 1998
Sold by
Federal National Mortgage Association
Bought by
Chase Curt and Chase Jane
Current Estimated Value
Home Financials for this Owner
Home Financials are based on the most recent Mortgage that was taken out on this home.
Original Mortgage
$126,000
Outstanding Balance
$25,470
Interest Rate
7.17%
Mortgage Type
Seller Take Back
Estimated Equity
$465,688
Purchase Details
Closed on
Mar 16, 1998
Sold by
Allen Neal B and Allen Debbie M
Bought by
Federal National Mortgage Association
Purchase Details
Closed on
Jun 10, 1994
Sold by
Inco Homes Corp
Bought by
Allen Neal B and Allen Debbie M
Home Financials for this Owner
Home Financials are based on the most recent Mortgage that was taken out on this home.
Original Mortgage
$153,400
Interest Rate
8.56%
Create a Home Valuation Report for This Property
The Home Valuation Report is an in-depth analysis detailing your home's value as well as a comparison with similar homes in the area
Home Values in the Area
Average Home Value in this Area
Purchase History
| Date | Buyer | Sale Price | Title Company |
|---|---|---|---|
| Chase Curt | $130,000 | First American Title Ins Co | |
| Federal National Mortgage Association | $110,000 | North American Title Co | |
| Allen Neal B | $161,500 | First American Title Ins Co |
Source: Public Records
Mortgage History
| Date | Status | Borrower | Loan Amount |
|---|---|---|---|
| Open | Chase Curt | $126,000 | |
| Previous Owner | Allen Neal B | $153,400 |
Source: Public Records
Tax History Compared to Growth
Tax History
| Year | Tax Paid | Tax Assessment Tax Assessment Total Assessment is a certain percentage of the fair market value that is determined by local assessors to be the total taxable value of land and additions on the property. | Land | Improvement |
|---|---|---|---|---|
| 2025 | $2,612 | $225,373 | $31,354 | $194,019 |
| 2024 | $2,612 | $220,954 | $30,739 | $190,215 |
| 2023 | $2,584 | $216,621 | $30,136 | $186,485 |
| 2022 | $2,536 | $212,373 | $29,545 | $182,828 |
| 2021 | $2,672 | $208,209 | $28,966 | $179,243 |
| 2020 | $2,624 | $206,074 | $28,669 | $177,405 |
| 2019 | $2,606 | $202,033 | $28,107 | $173,926 |
| 2018 | $2,631 | $198,072 | $27,556 | $170,516 |
| 2017 | $2,558 | $194,189 | $27,016 | $167,173 |
| 2016 | $2,363 | $190,381 | $26,486 | $163,895 |
| 2015 | $2,426 | $187,521 | $26,088 | $161,433 |
| 2014 | $2,401 | $183,848 | $25,577 | $158,271 |
Source: Public Records
Map
Nearby Homes
- 12658 Shorewood Way
- 12804 Sweetwater Dr
- 12709 Gaines St
- 12940 Blair St
- 12602 El Dorado Place
- 0 El Dorado St Unit SR25115583
- 12833 Biscayne Ave
- 12912 Amador St
- 13020 Banning St
- 12866 Albright Ct
- 12451 Antelope Dr
- 13073 Snowview Rd
- 12884 Caesar Ln
- 12753 Cardinal Ct
- 13118 Four Hills Way
- 12480 Terrano Dr
- 13150 Banning St
- 12373 Albatross St
- 12477 Redrock Ct
- 12862 Fencerider Way
- 12811 Cimarron Way
- 12793 Cimarron Way
- 12804 Heston St
- 12798 Heston St
- 12788 Heston St
- 12783 Cimarron Way
- 12798 Cimarron Way
- 12808 Cimarron Way
- 12788 Cimarron Way
- 12818 Cimarron Way
- 12832 Heston St
- 12776 Heston St
- 12773 Cimarron Way
- 12828 Cimarron Way
- 12803 Heston St
- 12806 Foley St
- 12780 Cimarron Way
- 12811 Heston St
- 12843 Cimarron Way