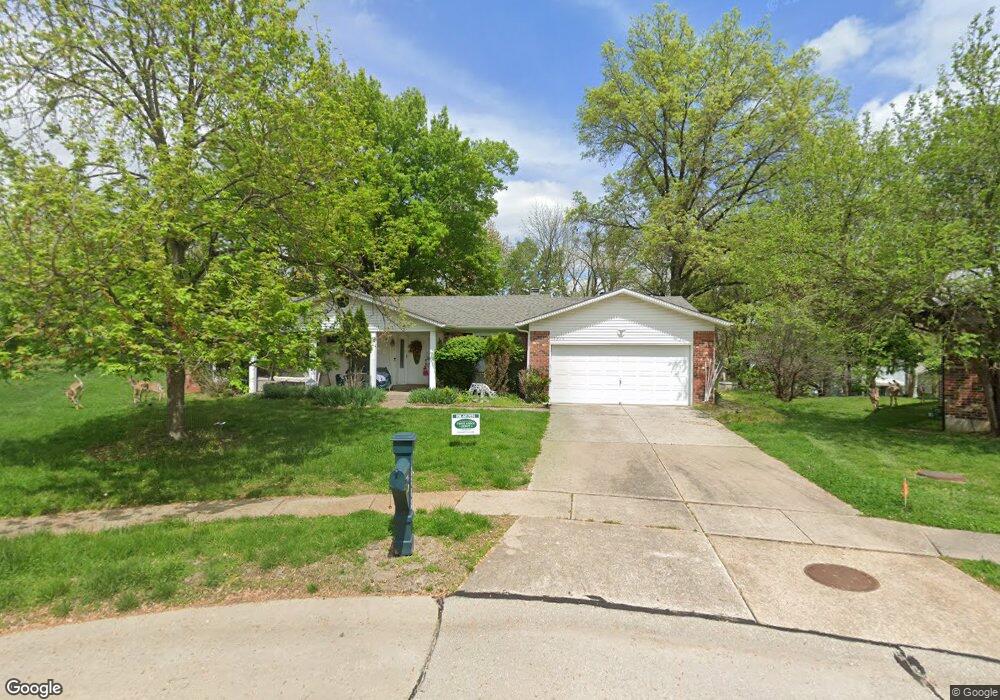
12802 Hasbrook Dr Saint Louis, MO 63146
Estimated Value: $371,014 - $413,000
3
Beds
2
Baths
1,759
Sq Ft
$222/Sq Ft
Est. Value
About This Home
This home is located at 12802 Hasbrook Dr, Saint Louis, MO 63146 and is currently estimated at $390,754, approximately $222 per square foot. 12802 Hasbrook Dr is a home located in St. Louis County with nearby schools including McKelvey Elementary School, Parkway Northeast Middle School, and Parkway North High School.
Ownership History
Date
Name
Owned For
Owner Type
Purchase Details
Closed on
Apr 14, 2004
Sold by
Davis Arras Julia and Martin Andrew James
Bought by
Smith Robert A and Smith Edie Cornell
Current Estimated Value
Home Financials for this Owner
Home Financials are based on the most recent Mortgage that was taken out on this home.
Original Mortgage
$188,000
Outstanding Balance
$75,014
Interest Rate
3.5%
Mortgage Type
Purchase Money Mortgage
Estimated Equity
$315,740
Purchase Details
Closed on
Jul 9, 2002
Sold by
A G Edwards Trust Company Fsb
Bought by
Davis Julia A and Martin Andrew James
Home Financials for this Owner
Home Financials are based on the most recent Mortgage that was taken out on this home.
Original Mortgage
$56,000
Interest Rate
6.76%
Purchase Details
Closed on
Aug 6, 2001
Sold by
Guemmer Juanita S
Bought by
A G Edwards Trust Company Fsb
Create a Home Valuation Report for This Property
The Home Valuation Report is an in-depth analysis detailing your home's value as well as a comparison with similar homes in the area
Home Values in the Area
Average Home Value in this Area
Purchase History
| Date | Buyer | Sale Price | Title Company |
|---|---|---|---|
| Smith Robert A | $235,000 | -- | |
| Davis Julia A | $176,000 | -- | |
| A G Edwards Trust Company Fsb | -- | -- |
Source: Public Records
Mortgage History
| Date | Status | Borrower | Loan Amount |
|---|---|---|---|
| Open | Smith Robert A | $188,000 | |
| Previous Owner | Davis Julia A | $56,000 |
Source: Public Records
Tax History Compared to Growth
Tax History
| Year | Tax Paid | Tax Assessment Tax Assessment Total Assessment is a certain percentage of the fair market value that is determined by local assessors to be the total taxable value of land and additions on the property. | Land | Improvement |
|---|---|---|---|---|
| 2025 | $3,849 | $62,070 | $26,160 | $35,910 |
| 2024 | $3,849 | $58,080 | $22,420 | $35,660 |
| 2023 | $3,693 | $58,080 | $22,420 | $35,660 |
| 2022 | $3,437 | $49,170 | $22,420 | $26,750 |
| 2021 | $3,423 | $49,170 | $22,420 | $26,750 |
| 2020 | $3,171 | $43,720 | $14,950 | $28,770 |
| 2019 | $3,102 | $43,720 | $14,950 | $28,770 |
| 2018 | $3,200 | $41,840 | $16,820 | $25,020 |
| 2017 | $3,113 | $41,840 | $16,820 | $25,020 |
| 2016 | $3,093 | $39,500 | $14,000 | $25,500 |
| 2015 | $3,241 | $39,500 | $14,000 | $25,500 |
| 2014 | $3,122 | $40,840 | $8,270 | $32,570 |
Source: Public Records
Map
Nearby Homes
- 1834 Chelmsford Ct
- 12929 Ballantine Ct
- 12818 Willowyck Dr
- 13033 King Arthur Spur
- 1702 Pensacola Dr
- 1935 Marine Terrace Dr Unit D
- 1948 Marine Terrace Dr Unit A
- 1960 Marine Terrace Dr Unit H
- 1960 Marine Terrace Dr Unit K
- 12980 Mayerling Dr
- 12964 Autumn View Dr
- 12725 Westport Dr
- 1444 Nancy Lee Dr
- 12924 Autumn View Dr
- 2115 Riding Spur Dr
- 13104 Fourposter Ct
- 12929 Portulaca Dr Unit 310
- 13041 Tiger Lily Ct Unit 10
- 1324 Golden Point Dr
- 12812 Portulaca Dr Unit K
- 12806 Hasbrook Dr
- 12803 Hasbrook Dr
- 12807 Hasbrook Dr
- 12812 Hasbrook Dr
- 1811 Chelmsford Ct
- 1817 Chelmsford Ct
- 1807 Chelmsford Ct
- 12819 Hasbrook Dr
- 1840 Elmira Ct
- 1823 Chelmsford Ct
- 1848 Elmira Ct
- 12820 Hasbrook Dr
- 1829 Chelmsford Ct
- 1801 Chelmsford Ct
- 12831 Hasbrook Dr
- 1841 Elmira Ct
- 1835 Chelmsford Ct
- 12828 Hasbrook Dr
- 1846 Seven Pines Dr
- 1820 Chelmsford Ct