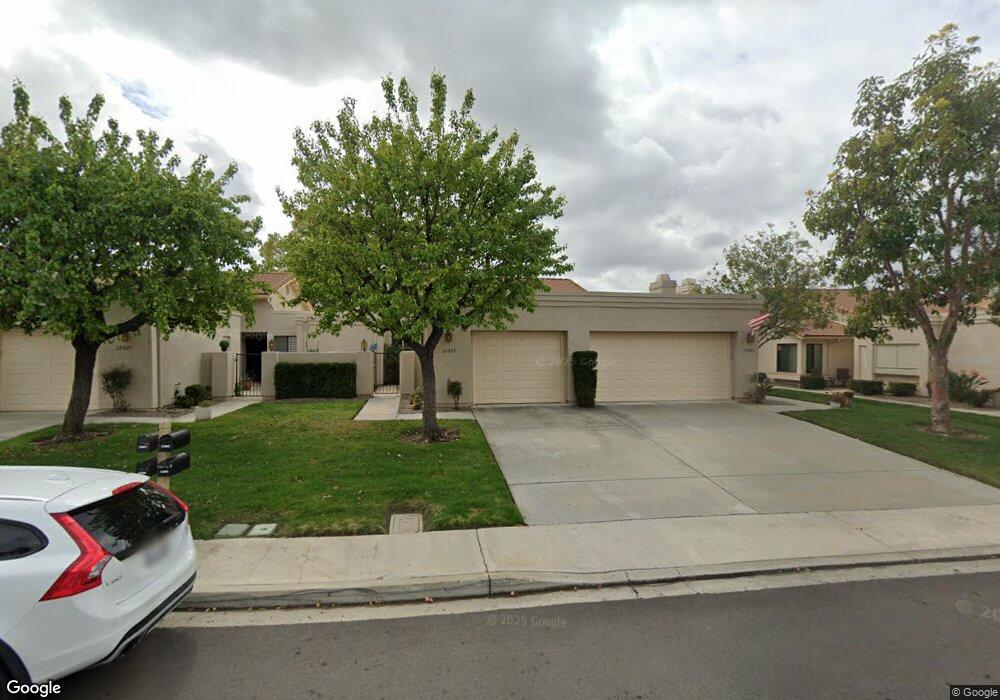
12803 Via Moura Unit 203 San Diego, CA 92128
Rancho Bernardo NeighborhoodEstimated Value: $751,000 - $969,000
2
Beds
2
Baths
1,388
Sq Ft
$590/Sq Ft
Est. Value
About This Home
This home is located at 12803 Via Moura Unit 203, San Diego, CA 92128 and is currently estimated at $818,559, approximately $589 per square foot. 12803 Via Moura Unit 203 is a home located in San Diego County with nearby schools including Chaparral Elementary, Bernardo Heights Middle, and Rancho Bernardo High.
Ownership History
Date
Name
Owned For
Owner Type
Purchase Details
Closed on
Apr 16, 2015
Sold by
Hoover Robert L
Bought by
The Sosnowski Family 2011 Trust
Current Estimated Value
Home Financials for this Owner
Home Financials are based on the most recent Mortgage that was taken out on this home.
Original Mortgage
$292,500
Outstanding Balance
$225,090
Interest Rate
3.73%
Mortgage Type
New Conventional
Estimated Equity
$593,469
Purchase Details
Closed on
May 23, 2012
Sold by
Hoover Robert L
Bought by
Hoover Robert L
Purchase Details
Closed on
May 1, 2012
Sold by
Joannero Susan
Bought by
Hoover Robert L
Purchase Details
Closed on
Apr 4, 2007
Sold by
Jeannero Ann P
Bought by
Jeannero Douglas M and Jeannero Ann P
Purchase Details
Closed on
Sep 8, 1995
Sold by
Friedman Muriel A
Bought by
Jeannero Douglas M and Jeannero Ann P
Purchase Details
Closed on
Jul 19, 1985
Create a Home Valuation Report for This Property
The Home Valuation Report is an in-depth analysis detailing your home's value as well as a comparison with similar homes in the area
Home Values in the Area
Average Home Value in this Area
Purchase History
| Date | Buyer | Sale Price | Title Company |
|---|---|---|---|
| The Sosnowski Family 2011 Trust | $390,000 | Lawyers Title | |
| Hoover Robert L | -- | None Available | |
| Hoover Robert L | $310,000 | Lawyers Title Company | |
| Jeannero Douglas M | -- | None Available | |
| Jeannero Douglas M | -- | None Available | |
| Jeannero Douglas M | -- | None Available | |
| Jeannero Douglas M | $160,000 | California Coast Title | |
| -- | $131,500 | -- |
Source: Public Records
Mortgage History
| Date | Status | Borrower | Loan Amount |
|---|---|---|---|
| Open | The Sosnowski Family 2011 Trust | $292,500 |
Source: Public Records
Tax History Compared to Growth
Tax History
| Year | Tax Paid | Tax Assessment Tax Assessment Total Assessment is a certain percentage of the fair market value that is determined by local assessors to be the total taxable value of land and additions on the property. | Land | Improvement |
|---|---|---|---|---|
| 2025 | $5,140 | $468,710 | $74,895 | $393,815 |
| 2024 | $5,140 | $459,521 | $73,427 | $386,094 |
| 2023 | $5,030 | $450,512 | $71,988 | $378,524 |
| 2022 | $4,945 | $441,679 | $70,577 | $371,102 |
| 2021 | $4,879 | $433,020 | $69,194 | $363,826 |
| 2020 | $4,813 | $428,581 | $68,485 | $360,096 |
| 2019 | $4,687 | $420,179 | $67,143 | $353,036 |
| 2018 | $4,554 | $411,941 | $65,827 | $346,114 |
| 2017 | $83 | $403,865 | $64,537 | $339,328 |
| 2016 | $4,340 | $395,947 | $63,272 | $332,675 |
| 2015 | $3,545 | $323,980 | $51,772 | $272,208 |
| 2014 | -- | $317,634 | $50,758 | $266,876 |
Source: Public Records
Map
Nearby Homes
- 12870 Camino de la Breccia
- 18035 Avenida Alozdra Unit 298
- 12865 Camino de la Breccia Unit 109
- 12880 Circulo Dardo
- 12725 Via Nasca
- 17909 Avenida Alozdra
- 17762 Plaza Acosta
- 17738 Plaza Acosta
- 17842 Avenida Cordillera Unit 30
- 12732 Camino de la Breccia Unit 9
- 12977 Camino Emparrado
- 18018 Calle Estepona
- 17676 Corte Sobrado
- 17780 Cumana Terrace
- 13356 Corte de Chucena
- 13025 Avenida Marbella
- 13060 Avenida Marbella
- 18787 Aceituno St
- 18818 Bernardo Trails Dr Unit 6
- 12516 Camino Vuelo
- 12813 Via Moura Unit 207
- 12807 Via Moura
- 12823 Via Moura
- 12805 Via Moura Unit 204
- 12839 Via Moura
- 12837 Via Moura Unit 217
- 12835 Via Moura
- 12833 Via Moura
- 12825 Via Moura Unit 212
- 12819 Via Moura
- 12809 Via Moura Unit 206
- 12829 Via Moura
- 12817 Via Moura
- 12815 Via Moura
- 12827 Via Moura
- 12834 Camino de la Breccia
- 12836 Camino Breccia Unit 130
- 12852 Camino Breccia Unit 126
- 12864 Camino Breccia Unit 123
- 12884 Camino Breccia Unit 119