12806 NE 117th Cir Unit Lot92 Vancouver, WA 98682
Orchards Area NeighborhoodEstimated Value: $465,805 - $521,000
4
Beds
3
Baths
1,748
Sq Ft
$277/Sq Ft
Est. Value
About This Home
This home is located at 12806 NE 117th Cir Unit Lot92, Vancouver, WA 98682 and is currently estimated at $484,951, approximately $277 per square foot. 12806 NE 117th Cir Unit Lot92 is a home located in Clark County with nearby schools including Glenwood Heights Primary School, Laurin Middle School, and Prairie High School.
Ownership History
Date
Name
Owned For
Owner Type
Purchase Details
Closed on
Apr 8, 2019
Sold by
Isaacs Nathan M and Isaacs Nicole R
Bought by
Daltoso Nicholas and Daltoso Jessica
Current Estimated Value
Home Financials for this Owner
Home Financials are based on the most recent Mortgage that was taken out on this home.
Original Mortgage
$294,000
Outstanding Balance
$258,478
Interest Rate
4.3%
Mortgage Type
New Conventional
Estimated Equity
$226,473
Purchase Details
Closed on
Jan 16, 2016
Sold by
D R Horton Inc Portland
Bought by
Isaacs Nathan M and Isaacs Nicole R
Home Financials for this Owner
Home Financials are based on the most recent Mortgage that was taken out on this home.
Original Mortgage
$241,490
Interest Rate
3.94%
Mortgage Type
New Conventional
Purchase Details
Closed on
Sep 25, 2015
Sold by
Mcm Of Washington Inc
Bought by
D R Horton Inc
Create a Home Valuation Report for This Property
The Home Valuation Report is an in-depth analysis detailing your home's value as well as a comparison with similar homes in the area
Home Values in the Area
Average Home Value in this Area
Purchase History
| Date | Buyer | Sale Price | Title Company |
|---|---|---|---|
| Daltoso Nicholas | $325,000 | Fidelity Natl Ttl Fishers La | |
| Isaacs Nathan M | $254,200 | Chicago Title Dt Vancouver | |
| D R Horton Inc | $1,049,000 | Chicago Title Fl Vancouver |
Source: Public Records
Mortgage History
| Date | Status | Borrower | Loan Amount |
|---|---|---|---|
| Open | Daltoso Nicholas | $294,000 | |
| Previous Owner | Isaacs Nathan M | $241,490 |
Source: Public Records
Tax History Compared to Growth
Tax History
| Year | Tax Paid | Tax Assessment Tax Assessment Total Assessment is a certain percentage of the fair market value that is determined by local assessors to be the total taxable value of land and additions on the property. | Land | Improvement |
|---|---|---|---|---|
| 2025 | $3,566 | $435,944 | $133,400 | $302,544 |
| 2024 | $3,390 | $416,933 | $133,400 | $283,533 |
| 2023 | $3,647 | $449,637 | $138,000 | $311,637 |
| 2022 | $3,491 | $443,370 | $150,650 | $292,720 |
| 2021 | $3,474 | $369,472 | $126,500 | $242,972 |
| 2020 | $3,189 | $336,226 | $115,000 | $221,226 |
| 2019 | $2,694 | $300,306 | $101,500 | $198,806 |
| 2018 | $3,176 | $288,879 | $0 | $0 |
| 2017 | $2,824 | $261,273 | $0 | $0 |
| 2016 | $437 | $252,139 | $0 | $0 |
| 2015 | -- | $65,000 | $0 | $0 |
Source: Public Records
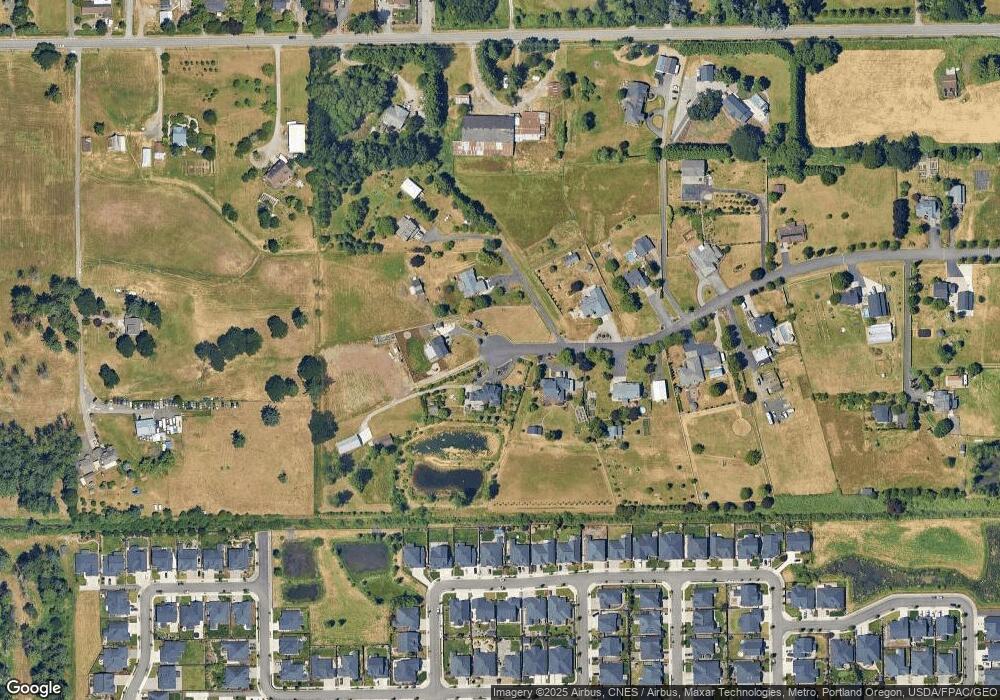
Map
Nearby Homes
- 11703 NE 128th Place
- 11620 NE 131st Ave
- 11527 NE 126th Ave
- 11501 NE 131st Place
- 11516 NE 126th Ave
- 11530 NE 125th Ave
- 12529 NE 114th Way
- 11314 NE 127th Ct
- 12313 NE 116th St
- 11121 NE 131st Ave
- 11217 NE 134th Place
- 13314 NE 112th St
- 11113 NE 131st Ave
- 12702 NE 109th St
- Bradford Plan at Luden Estates
- Moonstone Plan at Luden Estates
- Laurel Plan at Luden Estates
- 12721 NE 111th St
- 11110 NE 124th Ave
- 11613 NE 136th Ave
- 12806 NE 117th Cir
- 12808 NE 117th Cir
- 12808 NE 117th Cir
- 12808 NE 117th Cir Unit Lot91
- 12804 NE 117th Cir
- 12804 NE 117th Cir Unit Lot93
- 12804 NE 117th Cir
- 12805 NE 117th Cir
- 12805 NE 117th Cir
- 12805 NE 117th Cir Unit lot94
- 12810 NE 117th Cir
- 12810 NE 117th Cir Unit Lot90
- 12810 NE 117th Cir
- 12905 NE 118th St Unit Lot85
- 12909 NE 118th St Unit Lot84
- 12909 NE 118th St
- 12905 NE 118th St Unit Lot85
- 12905 NE 118th St
- 12915 NE 118th St Unit Lot83
- 12915 NE 118th St