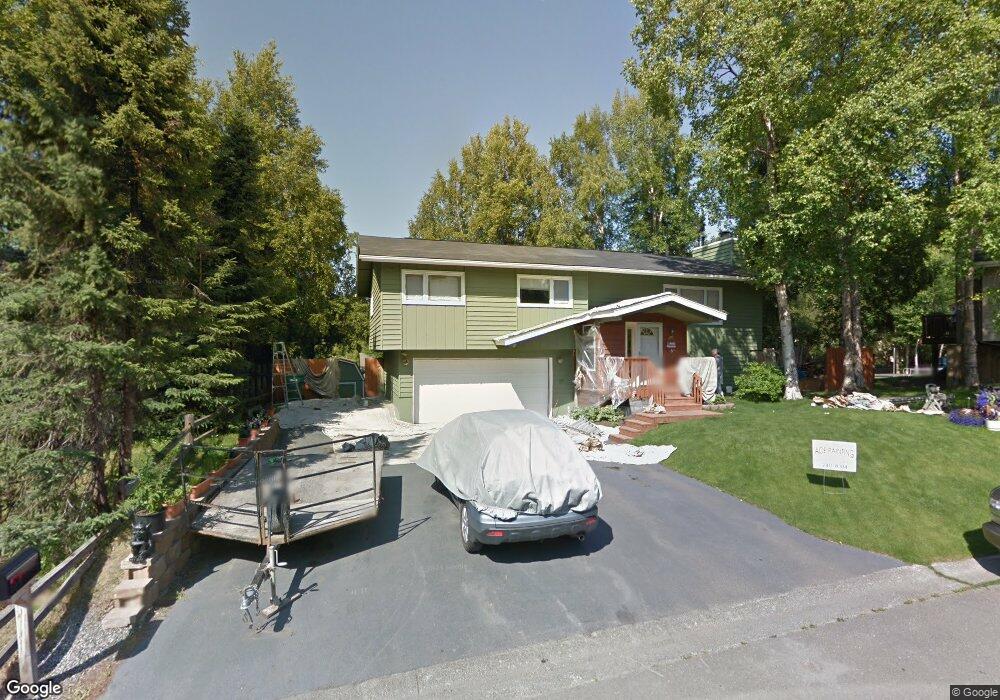
12810 Crows Cir Anchorage, AK 99515
Old Seward-Oceanview NeighborhoodEstimated Value: $337,000 - $515,000
3
Beds
3
Baths
1,992
Sq Ft
$217/Sq Ft
Est. Value
About This Home
This home is located at 12810 Crows Cir, Anchorage, AK 99515 and is currently estimated at $431,418, approximately $216 per square foot. 12810 Crows Cir is a home located in Anchorage Municipality with nearby schools including Ocean View Elementary School, Goldenview Middle School, and South Anchorage High School.
Ownership History
Date
Name
Owned For
Owner Type
Purchase Details
Closed on
Sep 25, 2000
Sold by
Woodland William B and Woodland Judy L
Bought by
Clifton Curtiss J and Clifton Pamela J
Current Estimated Value
Home Financials for this Owner
Home Financials are based on the most recent Mortgage that was taken out on this home.
Original Mortgage
$177,675
Outstanding Balance
$65,491
Interest Rate
8.07%
Mortgage Type
VA
Estimated Equity
$365,927
Purchase Details
Closed on
Feb 27, 1997
Sold by
Ricks Charles L
Bought by
Clifton Curtiss J and Clifton Pamela J
Purchase Details
Closed on
Oct 29, 1993
Sold by
Blackledge Gerald A
Bought by
Ricks Charles L
Home Financials for this Owner
Home Financials are based on the most recent Mortgage that was taken out on this home.
Original Mortgage
$138,947
Interest Rate
6.95%
Mortgage Type
FHA
Create a Home Valuation Report for This Property
The Home Valuation Report is an in-depth analysis detailing your home's value as well as a comparison with similar homes in the area
Home Values in the Area
Average Home Value in this Area
Purchase History
| Date | Buyer | Sale Price | Title Company |
|---|---|---|---|
| Clifton Curtiss J | -- | -- | |
| Murphy Donald G | -- | -- | |
| Clifton Curtiss J | -- | -- | |
| Clifton Curtiss J | -- | -- | |
| Ricks Charles L | -- | -- | |
| Ricks Charles L | -- | -- |
Source: Public Records
Mortgage History
| Date | Status | Borrower | Loan Amount |
|---|---|---|---|
| Open | Murphy Donald G | $177,675 | |
| Closed | Clifton Curtiss J | $148,000 | |
| Previous Owner | Ricks Charles L | $138,947 | |
| Closed | Clifton Curtiss J | $0 |
Source: Public Records
Tax History
| Year | Tax Paid | Tax Assessment Tax Assessment Total Assessment is a certain percentage of the fair market value that is determined by local assessors to be the total taxable value of land and additions on the property. | Land | Improvement |
|---|---|---|---|---|
| 2025 | $5,279 | $435,600 | $123,700 | $311,900 |
| 2024 | $5,279 | $402,000 | $123,700 | $278,300 |
| 2023 | $6,289 | $369,300 | $123,700 | $245,600 |
| 2022 | $5,217 | $359,800 | $123,700 | $236,100 |
| 2021 | $6,060 | $336,300 | $123,700 | $212,600 |
| 2020 | $4,709 | $327,300 | $123,700 | $203,600 |
| 2019 | $4,576 | $329,700 | $123,700 | $206,000 |
| 2018 | $4,449 | $321,300 | $123,700 | $197,600 |
| 2017 | $4,767 | $324,400 | $123,700 | $200,700 |
| 2016 | $4,205 | $331,100 | $123,700 | $207,400 |
| 2015 | $4,205 | $322,800 | $123,700 | $199,100 |
| 2014 | $4,205 | $301,900 | $119,900 | $182,000 |
Source: Public Records
Map
Nearby Homes
- 12961 Nora Dr
- 12371 Gregg Ln Unit 71
- 12106 Lucille Ln Unit 1
- 1548 Cara Loop Unit 5B
- 402 Ocean Point Dr Unit 16
- 291 Dailey Ave Unit 8
- 271 Dailey Ave Unit 12
- 250 Botanical Cir
- 170 Ocean Park Dr
- 166 Ocean Park Dr
- 12621 Estuary Cir
- 1956 Sonoma Crest Cir
- 2103 Tributary Cir
- 1105 E Klatt Rd
- 9031 Old Seward Hwy
- 12210 Mary Ave
- 11418 Moonrise Ridge Place Unit 19
- 13730 Sunset View St
- 11323 Lillian Ln
- 1100 E 112th Ave Unit 2
- 12800 Crows Cir
- 12820 Crows Cir
- 800 Lighthouse Ct
- 710 Lighthouse Ct
- 810 Lighthouse Ct
- 700 Lighthouse Ct
- 12801 Crows Cir
- 12831 Crows Cir
- 12830 Crows Cir
- 12807 Nora Dr
- 12811 Crows Cir
- 820 Lighthouse Ct
- 12817 Nora Dr
- 630 Lighthouse Ct
- 12840 Crows Cir
- 721 Lighthouse Ct
- 12849 Crows Cir
- 711 High View Dr
- 711 Lighthouse Ct
- 12821 Nora Dr
Your Personal Tour Guide
Ask me questions while you tour the home.