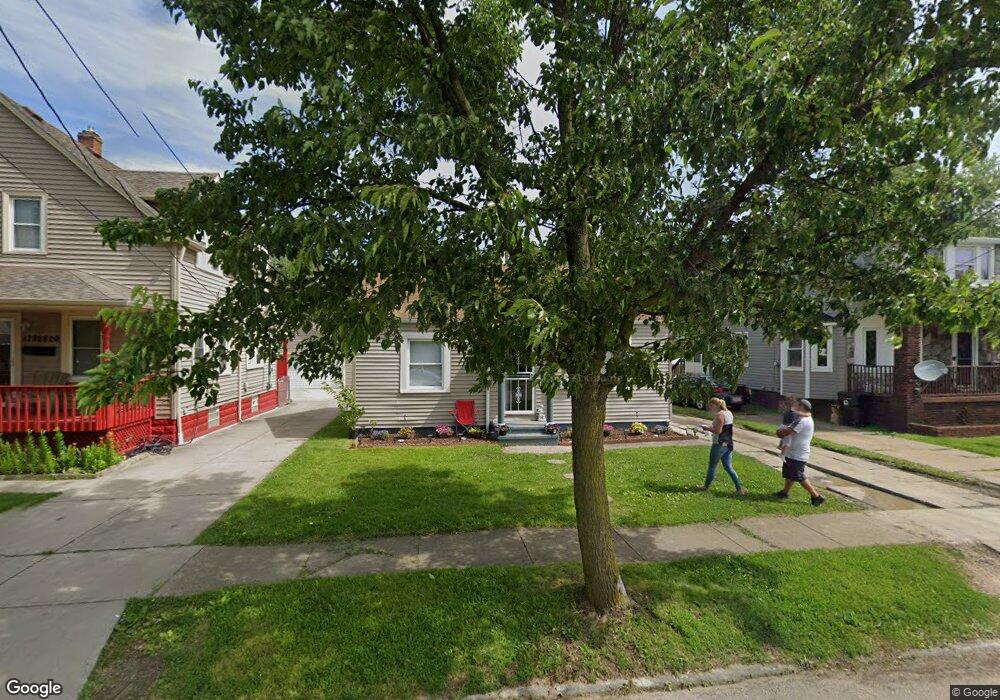
12814 Lena Ave Cleveland, OH 44135
Bellaire-Puritas NeighborhoodEstimated Value: $94,000 - $101,000
2
Beds
1
Bath
696
Sq Ft
$141/Sq Ft
Est. Value
About This Home
This home is located at 12814 Lena Ave, Cleveland, OH 44135 and is currently estimated at $97,948, approximately $140 per square foot. 12814 Lena Ave is a home located in Cuyahoga County with nearby schools including Artemus Ward School, Almira Academy, and Benjamin Franklin.
Ownership History
Date
Name
Owned For
Owner Type
Purchase Details
Closed on
Mar 5, 2004
Sold by
Hytree Millicent M and Titlow Nancy
Bought by
Quinones Allen
Current Estimated Value
Home Financials for this Owner
Home Financials are based on the most recent Mortgage that was taken out on this home.
Original Mortgage
$48,500
Outstanding Balance
$22,825
Interest Rate
5.77%
Mortgage Type
Purchase Money Mortgage
Estimated Equity
$75,123
Purchase Details
Closed on
Jun 22, 1990
Sold by
Titlow Robert M
Bought by
Hytree Lioyd C
Purchase Details
Closed on
Nov 30, 1988
Sold by
Hytree Lloyd C
Bought by
Titlow Robert M
Purchase Details
Closed on
Apr 14, 1988
Sold by
Augustine Daniel
Bought by
Hytree Lloyd C
Purchase Details
Closed on
Nov 30, 1987
Sold by
Augustine Frank E
Bought by
Augustine Daniel
Purchase Details
Closed on
Oct 12, 1984
Sold by
Augustine Frank E and Augustine Jean L
Bought by
Augustine Frank E
Purchase Details
Closed on
Jan 1, 1975
Bought by
Augustine Frank E and Augustine Jean L
Create a Home Valuation Report for This Property
The Home Valuation Report is an in-depth analysis detailing your home's value as well as a comparison with similar homes in the area
Home Values in the Area
Average Home Value in this Area
Purchase History
| Date | Buyer | Sale Price | Title Company |
|---|---|---|---|
| Quinones Allen | $50,000 | Equity Title Agency Inc | |
| Hytree Lioyd C | -- | -- | |
| Titlow Robert M | -- | -- | |
| Hytree Lloyd C | $24,000 | -- | |
| Augustine Daniel | -- | -- | |
| Augustine Frank E | -- | -- | |
| Augustine Frank E | -- | -- | |
| Augustine Frank E | -- | -- |
Source: Public Records
Mortgage History
| Date | Status | Borrower | Loan Amount |
|---|---|---|---|
| Open | Quinones Allen | $48,500 |
Source: Public Records
Tax History Compared to Growth
Tax History
| Year | Tax Paid | Tax Assessment Tax Assessment Total Assessment is a certain percentage of the fair market value that is determined by local assessors to be the total taxable value of land and additions on the property. | Land | Improvement |
|---|---|---|---|---|
| 2024 | $1,502 | $22,470 | $7,210 | $15,260 |
| 2023 | $1,302 | $16,800 | $4,200 | $12,600 |
| 2022 | $1,295 | $16,800 | $4,200 | $12,600 |
| 2021 | $1,283 | $16,800 | $4,200 | $12,600 |
| 2020 | $1,151 | $13,020 | $3,260 | $9,770 |
| 2019 | $1,066 | $37,200 | $9,300 | $27,900 |
| 2018 | $1,135 | $13,020 | $3,260 | $9,770 |
| 2017 | $1,217 | $14,390 | $3,260 | $11,130 |
| 2016 | $1,207 | $14,390 | $3,260 | $11,130 |
| 2015 | $1,318 | $14,390 | $3,260 | $11,130 |
| 2014 | $1,318 | $15,650 | $3,540 | $12,110 |
Source: Public Records
Map
Nearby Homes
- 12701 Milligan Ave
- 12613 Milligan Ave
- 12518 Erwin Ave
- 4329 W 131st St
- 4349 W 132nd St
- 13104 Wainfleet Ave
- 12010 Longmead Ave
- 13401 Puritas Ave
- 13410 Gilmore Ave
- 12620 Grimsby Ave
- 12009 Mcgowan Ave
- 12519 Carrington Ave
- 12510 Grimsby Ave
- 13410 Wainfleet Ave
- 12301 Carrington Ave
- 12508 Sobieski Ave
- 12804 Astor Ave
- 13104 Astor Ave
- 12507 Astor Ave
- 13514 Bennington Ave