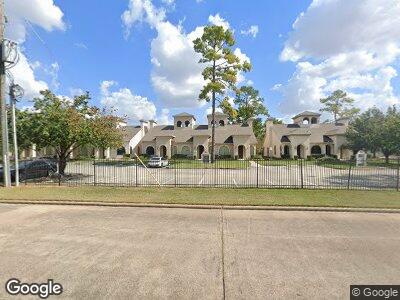
12816 Willow Centre Dr Unit B Houston, TX 77066
Champions NeighborhoodEstimated Value: $151,489
2
Beds
2
Baths
675
Sq Ft
$224/Sq Ft
Est. Value
About This Home
This home is located at 12816 Willow Centre Dr Unit B, Houston, TX 77066 and is currently priced at $151,489, approximately $224 per square foot. 12816 Willow Centre Dr Unit B is a home located in Harris County with nearby schools including Yeager Elementary School, Bleyl Middle School, and Cypress Creek High School.
Ownership History
Date
Name
Owned For
Owner Type
Purchase Details
Closed on
Feb 13, 2015
Sold by
Liu Xiao
Bought by
T&L Group Llc
Current Estimated Value
Purchase Details
Closed on
Sep 23, 2008
Sold by
Monticello Houston Property Llc
Bought by
Liu Enterprises Group Inc
Home Financials for this Owner
Home Financials are based on the most recent Mortgage that was taken out on this home.
Original Mortgage
$76,000
Interest Rate
6.52%
Mortgage Type
Seller Take Back
Purchase Details
Closed on
Jun 30, 2006
Sold by
Kaur Ranjit
Bought by
Monticello Houseen Properties Llc
Purchase Details
Closed on
Sep 15, 2005
Sold by
Bright Builders Llc
Bought by
Kaur Ranjit
Home Financials for this Owner
Home Financials are based on the most recent Mortgage that was taken out on this home.
Original Mortgage
$68,800
Interest Rate
5.88%
Mortgage Type
Purchase Money Mortgage
Create a Home Valuation Report for This Property
The Home Valuation Report is an in-depth analysis detailing your home's value as well as a comparison with similar homes in the area
Home Values in the Area
Average Home Value in this Area
Purchase History
| Date | Buyer | Sale Price | Title Company |
|---|---|---|---|
| T&L Group Llc | -- | Stewart Title Of Montgomery | |
| Liu Enterprises Group Inc | -- | Fidelity National Title | |
| Monticello Houseen Properties Llc | -- | Fidelity National Title | |
| Monticello Houseen Properties Llc | -- | Fidelity National Title | |
| Kaur Ranjit | -- | Fidelity National Title |
Source: Public Records
Mortgage History
| Date | Status | Borrower | Loan Amount |
|---|---|---|---|
| Previous Owner | Liu Enterprises Group Inc | $76,000 | |
| Previous Owner | Kaur Ranjit | $68,800 |
Source: Public Records
Tax History Compared to Growth
Tax History
| Year | Tax Paid | Tax Assessment Tax Assessment Total Assessment is a certain percentage of the fair market value that is determined by local assessors to be the total taxable value of land and additions on the property. | Land | Improvement |
|---|---|---|---|---|
| 2023 | $2,843 | $122,226 | $17,298 | $104,928 |
| 2022 | $2,851 | $124,259 | $17,298 | $106,961 |
| 2021 | $2,349 | $97,463 | $17,298 | $80,165 |
| 2020 | $2,305 | $92,955 | $17,298 | $75,657 |
| 2019 | $2,413 | $93,913 | $16,387 | $77,526 |
| 2018 | $1,255 | $87,149 | $16,387 | $70,762 |
| 2017 | $2,201 | $86,236 | $16,387 | $69,849 |
| 2016 | $2,235 | $87,570 | $16,640 | $70,930 |
| 2015 | $2,283 | $89,298 | $16,465 | $72,833 |
| 2014 | $2,283 | $88,377 | $16,465 | $71,912 |
Source: Public Records
Map
Nearby Homes
- 12832 Willow Centre Dr
- 0 Fm 1960 Rd W Unit 82666929
- 0 Fm 1960 Rd W Unit 53638376
- 0 Fm 1960 Rd W Unit 54433378
- 13215 Jessica Ln
- 13207 Sea Island Dr
- 6711 Pebble Beach Dr
- TBD Farm To Market 1960 Rd W
- 6723 Mossridge Dr
- 6906 Apple Valley Ln
- 7038 Centre Grove Dr
- 13600 Breton Ridge St Unit 25B
- 13600 Breton Ridge St Unit 21B
- 13600 Breton Ridge St Unit 12D
- 13600 Breton Ridge St Unit 32C
- 13600 Breton Ridge St Unit 22D
- 13600 Breton Ridge St Unit 25E
- 13600 Breton Ridge St Unit 15B
- 13600 Breton Ridge St Unit 7B
- 13600 Breton Ridge St Unit 23A
- 12816 Willow Centre Dr Unit B
- 12820 Willow Center Unit 12830
- 12812 Willow Centre Dr Unit B
- 12812 Willow Centre Dr Unit A & F
- 12818 Willow Centre Dr Unit A
- 12818 Willow Centre Dr Unit D
- 12818 Willow Centre Dr Unit C
- 12816 Willow Center
- 12816 Willow Center Unit C
- 12824 Willow Centre Dr Unit E
- 12830 Willow Centre Dr Unit B
- 12830 Willow Centre Dr Unit A & F
- 12834 Willow Center
- 12830 Willow Centre Dr
- 12834 Willow Center Unit D
- 12818 Willow Center Unit D
- 12818 Willow Center Unit D
- 12826 Willow Center Unit E
- 12806 Willow Center
- 12830 Willow Centre Dr Unit E