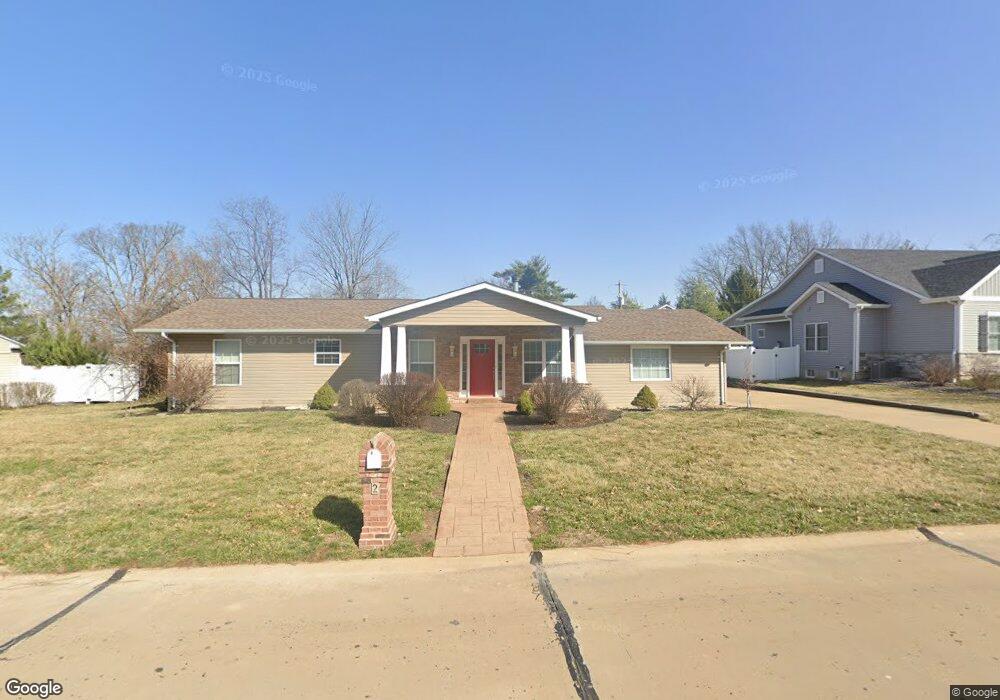
12819 Grandview Heights Saint Louis, MO 63131
Estimated Value: $325,715 - $523,000
3
Beds
2
Baths
1,125
Sq Ft
$378/Sq Ft
Est. Value
About This Home
This home is located at 12819 Grandview Heights, Saint Louis, MO 63131 and is currently estimated at $425,679, approximately $378 per square foot. 12819 Grandview Heights is a home located in St. Louis County with nearby schools including Barretts Elementary School, Parkway South Middle School, and Parkway South High School.
Ownership History
Date
Name
Owned For
Owner Type
Purchase Details
Closed on
Feb 23, 2018
Sold by
Ferguson Bradley Rhey and Ferguson Karen L Scaglion
Bought by
Williams Erin
Current Estimated Value
Purchase Details
Closed on
Apr 11, 2014
Sold by
Ferguson Daniel Rhey and Ferguson Bradley Rhey
Bought by
Ferguson Bradley Rhey and Ferguson Karen L Scaglione
Home Financials for this Owner
Home Financials are based on the most recent Mortgage that was taken out on this home.
Original Mortgage
$160,000
Interest Rate
4.34%
Mortgage Type
New Conventional
Purchase Details
Closed on
Jun 29, 2009
Sold by
Ferguson Daniel
Bought by
Ferguson Daniel Rhey and Ferguson Bradley Rhey
Purchase Details
Closed on
Apr 3, 1998
Sold by
Ferguson Renyold R and Ferguson Dorothy M
Bought by
Ferguson Renyold R and Ferguson Dorothy M
Create a Home Valuation Report for This Property
The Home Valuation Report is an in-depth analysis detailing your home's value as well as a comparison with similar homes in the area
Home Values in the Area
Average Home Value in this Area
Purchase History
| Date | Buyer | Sale Price | Title Company |
|---|---|---|---|
| Williams Erin | $288,500 | Title Partners Agency Llc | |
| Ferguson Bradley Rhey | -- | Title Partners Agency Llc | |
| Ferguson Daniel Rhey | -- | None Available | |
| Ferguson Renyold R | -- | -- |
Source: Public Records
Mortgage History
| Date | Status | Borrower | Loan Amount |
|---|---|---|---|
| Previous Owner | Ferguson Bradley Rhey | $160,000 |
Source: Public Records
Tax History Compared to Growth
Tax History
| Year | Tax Paid | Tax Assessment Tax Assessment Total Assessment is a certain percentage of the fair market value that is determined by local assessors to be the total taxable value of land and additions on the property. | Land | Improvement |
|---|---|---|---|---|
| 2025 | $2,527 | $80,510 | $49,440 | $31,070 |
| 2024 | $2,527 | $44,730 | $34,240 | $10,490 |
| 2023 | $2,491 | $44,730 | $34,240 | $10,490 |
| 2022 | $3,023 | $49,440 | $33,270 | $16,170 |
| 2021 | $2,998 | $49,440 | $33,270 | $16,170 |
| 2020 | $2,571 | $40,470 | $26,960 | $13,510 |
| 2019 | $2,535 | $40,470 | $26,960 | $13,510 |
| 2018 | $2,107 | $31,030 | $23,140 | $7,890 |
| 2017 | $2,079 | $31,030 | $23,140 | $7,890 |
| 2016 | $1,944 | $27,560 | $14,540 | $13,020 |
| 2015 | $2,048 | $27,560 | $14,540 | $13,020 |
| 2014 | $2,058 | $30,090 | $11,170 | $18,920 |
Source: Public Records
Map
Nearby Homes
- 12841 Thornhill Ct
- 2211 Viewroyal Dr
- 785 N Ballas Rd
- 1824 Topping Rd
- 2300 E Royal Ct
- 918 N Ballas Rd
- 12321 Ballas Estates Dr
- 2145 Trailcrest Dr
- 13385 Hiddendale Ln Unit 93
- 2376 Hiddengarden Ct Unit 75
- 2037 Trailcrest Ln Unit 7
- 698 Trailcrest Ct Unit 5
- 2033 Woodland Knoll
- 2025 Woodland Knoll
- 2017 Woodland Knoll
- 13112 Thornhill Dr
- 2005 Woodland Knoll
- 896 Twin Pine Dr
- 2002 Woodland Knoll
- 12439 Springdale Ln Unit TBB
- 1 Grandview Heights
- 3 Grandview Heights
- 11 Grandview Heights
- 10 Grandview Heights
- 12801 Wood Valley Ct
- 1069 Oge Ave
- 12834 Grandview Heights
- 9 Grandview Heights
- 4 Grandview Heights
- 73 Grandview Heights
- 0 Grandview Millbrook Tbb
- 72 Grandview Heights
- 71 Grandview Heights
- 935 Oge Ave
- 70 Grandview Heights
- 69 Grandview Heights
- 68 Grandview Heights
- 67 Grandview Heights
- 12807 Wood Valley Ct
- 12800 Wood Valley Ct