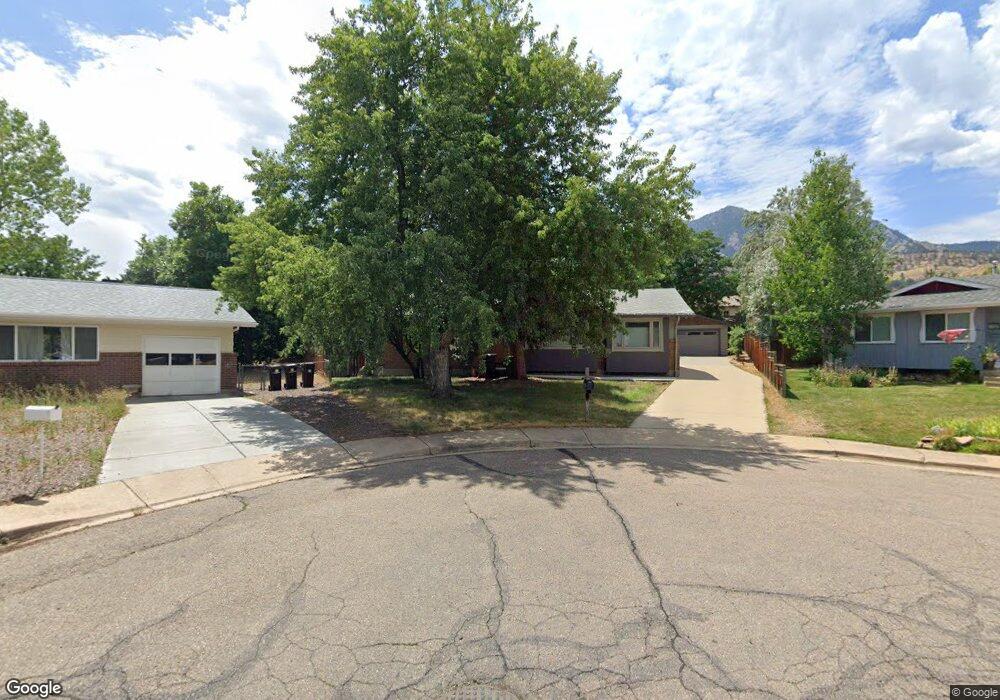
1282 Bear Mountain Ct Boulder, CO 80305
Table Mesa NeighborhoodEstimated Value: $1,082,587 - $1,281,000
3
Beds
1
Bath
1,291
Sq Ft
$919/Sq Ft
Est. Value
About This Home
This home is located at 1282 Bear Mountain Ct, Boulder, CO 80305 and is currently estimated at $1,186,647, approximately $919 per square foot. 1282 Bear Mountain Ct is a home located in Boulder County with nearby schools including Bear Creek Elementary School, Southern Hills Middle School, and Fairview High School.
Ownership History
Date
Name
Owned For
Owner Type
Purchase Details
Closed on
Sep 8, 2000
Sold by
Million Bonnie
Bought by
Aldrich Eric L and Aldrich Irene T
Current Estimated Value
Home Financials for this Owner
Home Financials are based on the most recent Mortgage that was taken out on this home.
Original Mortgage
$252,700
Outstanding Balance
$92,492
Interest Rate
8.16%
Estimated Equity
$1,094,155
Purchase Details
Closed on
Sep 7, 2000
Sold by
Grasse Carol
Bought by
Million Bonnie
Home Financials for this Owner
Home Financials are based on the most recent Mortgage that was taken out on this home.
Original Mortgage
$252,700
Outstanding Balance
$92,492
Interest Rate
8.16%
Estimated Equity
$1,094,155
Purchase Details
Closed on
Oct 18, 1999
Sold by
Willam Veronica Sandra and Willam Kaspar J
Bought by
Grasse Carol
Home Financials for this Owner
Home Financials are based on the most recent Mortgage that was taken out on this home.
Original Mortgage
$211,500
Interest Rate
7%
Purchase Details
Closed on
Oct 5, 1992
Bought by
Aldrich Eric L and Aldrich Irene T
Create a Home Valuation Report for This Property
The Home Valuation Report is an in-depth analysis detailing your home's value as well as a comparison with similar homes in the area
Home Values in the Area
Average Home Value in this Area
Purchase History
| Date | Buyer | Sale Price | Title Company |
|---|---|---|---|
| Aldrich Eric L | $335,900 | Land Title | |
| Million Bonnie | $211,942 | Land Title | |
| Grasse Carol | $235,000 | -- | |
| Aldrich Eric L | $132,500 | -- |
Source: Public Records
Mortgage History
| Date | Status | Borrower | Loan Amount |
|---|---|---|---|
| Open | Aldrich Eric L | $252,700 | |
| Previous Owner | Grasse Carol | $211,500 |
Source: Public Records
Tax History
| Year | Tax Paid | Tax Assessment Tax Assessment Total Assessment is a certain percentage of the fair market value that is determined by local assessors to be the total taxable value of land and additions on the property. | Land | Improvement |
|---|---|---|---|---|
| 2025 | $6,064 | $70,950 | $63,855 | $7,095 |
| 2024 | $6,064 | $70,950 | $63,855 | $7,095 |
| 2023 | $5,959 | $75,703 | $71,449 | $7,939 |
| 2022 | $5,194 | $62,884 | $55,475 | $7,409 |
| 2021 | $4,953 | $64,693 | $57,071 | $7,622 |
| 2020 | $4,124 | $54,526 | $43,615 | $10,911 |
| 2019 | $4,061 | $54,526 | $43,615 | $10,911 |
| 2018 | $3,872 | $51,854 | $37,080 | $14,774 |
| 2017 | $3,750 | $57,328 | $40,994 | $16,334 |
| 2016 | $3,146 | $44,305 | $29,850 | $14,455 |
| 2015 | $3,632 | $39,139 | $17,671 | $21,468 |
| 2014 | $3,291 | $39,139 | $17,671 | $21,468 |
Source: Public Records
Map
Nearby Homes
- 2860 Table Mesa Dr
- 2610 Iliff St
- 3210 Emerson Ave
- 2665 Juilliard St
- 2596 Briarwood Dr
- 1220 Edinboro Dr
- 3450 Emerson Ave
- 3490 Emerson Ave
- 623 Hartford Dr
- 2235 Vassar Dr
- 3590 Endicott Dr
- 2795 Vassar Dr
- 2585 Kohler Dr
- 2955 Stanford Ave
- 1965 Kohler Dr
- 3130 Kittrell Ct
- 1865 Kohler Dr
- 3394 Cripple Creek Trail Unit 15-H
- 3391 Cripple Creek Trail Unit E
- 3755 Silver Plume Ln
- 1284 Bear Mountain Ct
- 1278 Bear Mountain Ct
- 1343 Scrub Oak Cir
- 1337 Scrub Oak Cir
- 1347 Scrub Oak Cir
- 1351 Scrub Oak Cir
- 1288 Bear Mountain Ct
- 1333 Scrub Oak Cir
- 1276 Bear Mountain Ct
- 1355 Scrub Oak Cir
- 1294 Bear Mountain Ct
- 1327 Scrub Oak Cir
- 1323 Scrub Oak Cir
- 1272 Bear Mountain Ct
- 1357 Scrub Oak Cir
- 1300 Bear Mountain Ct
- 1313 Scrub Oak Cir
- 1338 Scrub Oak Cir
- 1342 Scrub Oak Cir
- 1348 Scrub Oak Cir
Your Personal Tour Guide
Ask me questions while you tour the home.