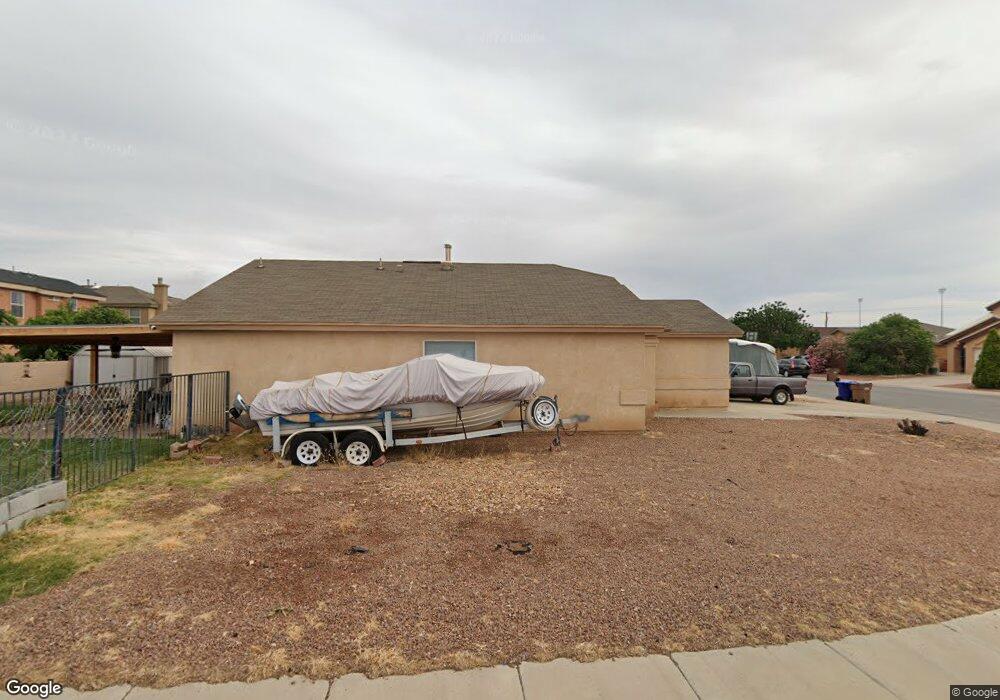
1282 Fountain Loop Las Cruces, NM 88007
Estimated Value: $222,669 - $237,000
3
Beds
2
Baths
1,207
Sq Ft
$190/Sq Ft
Est. Value
About This Home
This home is located at 1282 Fountain Loop, Las Cruces, NM 88007 and is currently estimated at $229,835, approximately $190 per square foot. 1282 Fountain Loop is a home located in Dona Ana County with nearby schools including Fairacres Elementary School, Picacho Middle School, and Mayfield High School.
Ownership History
Date
Name
Owned For
Owner Type
Purchase Details
Closed on
May 24, 2013
Sold by
Rbp Investment Llc
Bought by
Poloner Matthew and Poloner Rosalie
Current Estimated Value
Home Financials for this Owner
Home Financials are based on the most recent Mortgage that was taken out on this home.
Original Mortgage
$84,000
Outstanding Balance
$18,250
Interest Rate
3.43%
Mortgage Type
New Conventional
Estimated Equity
$211,585
Purchase Details
Closed on
Jan 5, 2011
Sold by
Poloner Matthew B and Poloner Rosalie Barr
Bought by
Rbp Investments Llc
Purchase Details
Closed on
Aug 30, 2006
Sold by
Desert View Homes
Bought by
Poloner Matthew B and Poloner Rosalie Barr
Home Financials for this Owner
Home Financials are based on the most recent Mortgage that was taken out on this home.
Original Mortgage
$103,960
Interest Rate
6.79%
Mortgage Type
Purchase Money Mortgage
Create a Home Valuation Report for This Property
The Home Valuation Report is an in-depth analysis detailing your home's value as well as a comparison with similar homes in the area
Home Values in the Area
Average Home Value in this Area
Purchase History
| Date | Buyer | Sale Price | Title Company |
|---|---|---|---|
| Poloner Matthew | -- | Title Source | |
| Rbp Investments Llc | -- | None Available | |
| Poloner Matthew B | -- | Las Cruces Abstract & Title |
Source: Public Records
Mortgage History
| Date | Status | Borrower | Loan Amount |
|---|---|---|---|
| Open | Poloner Matthew | $84,000 | |
| Previous Owner | Poloner Matthew B | $103,960 |
Source: Public Records
Tax History Compared to Growth
Tax History
| Year | Tax Paid | Tax Assessment Tax Assessment Total Assessment is a certain percentage of the fair market value that is determined by local assessors to be the total taxable value of land and additions on the property. | Land | Improvement |
|---|---|---|---|---|
| 2024 | $1,367 | $44,884 | $9,925 | $34,959 |
| 2023 | $1,348 | $43,578 | $9,912 | $33,666 |
| 2022 | $1,327 | $42,308 | $9,897 | $32,411 |
| 2021 | $1,284 | $41,076 | $9,810 | $31,266 |
| 2020 | $1,253 | $39,880 | $9,492 | $30,388 |
| 2019 | $1,220 | $38,719 | $9,152 | $29,567 |
| 2018 | $1,177 | $37,591 | $9,065 | $28,526 |
| 2017 | $1,049 | $36,496 | $8,981 | $27,515 |
| 2016 | $1,032 | $35,433 | $8,900 | $26,533 |
| 2015 | $1,038 | $106,300 | $26,700 | $79,600 |
| 2014 | $1,037 | $106,296 | $26,677 | $79,619 |
Source: Public Records
Map
Nearby Homes
- 2846 Fountain Ave
- 2849 Carretas Ct
- 1375 Fountain Loop
- 2970 Rillito Dr
- 2951 Fountain Ave
- 2555 Primavera St
- 1382 Anasazi Ct
- 2960 Ancho Ave
- 2970 Meriwether St
- TBD Picacho Ave
- 10840 Highway 70 E
- 900 Lake Tahoe Ct
- 3006 La Union Ct
- 3035 San Elizario Ct
- 3038 San Elizario Ct
- 3063 San Elizario Ct
- TBD Burke Rd
- 605 Vista Del Sol Place
- TBD Del Rio Dr
- 3412 Del Rio Ct
- 1278 Fountain Loop
- 1300 Doniphan Place
- 1274 Fountain Loop
- 1304 Doniphan Place
- 1299 Fountain Loop
- 1308 Doniphan Place
- 1295 Fountain Loop
- 1283 Fountain Loop
- 1307 Fountain Loop
- 1270 Fountain Loop
- 1279 Fountain Loop
- 1312 Doniphan Place
- 1287 Fountain Loop
- 1291 Fountain Loop
- 1311 Fountain Loop
- 1275 Fountain Loop
- 1266 Fountain Loop
- 1271 Fountain Loop
- - - Santana Rd
- 1315 Fountain Loop