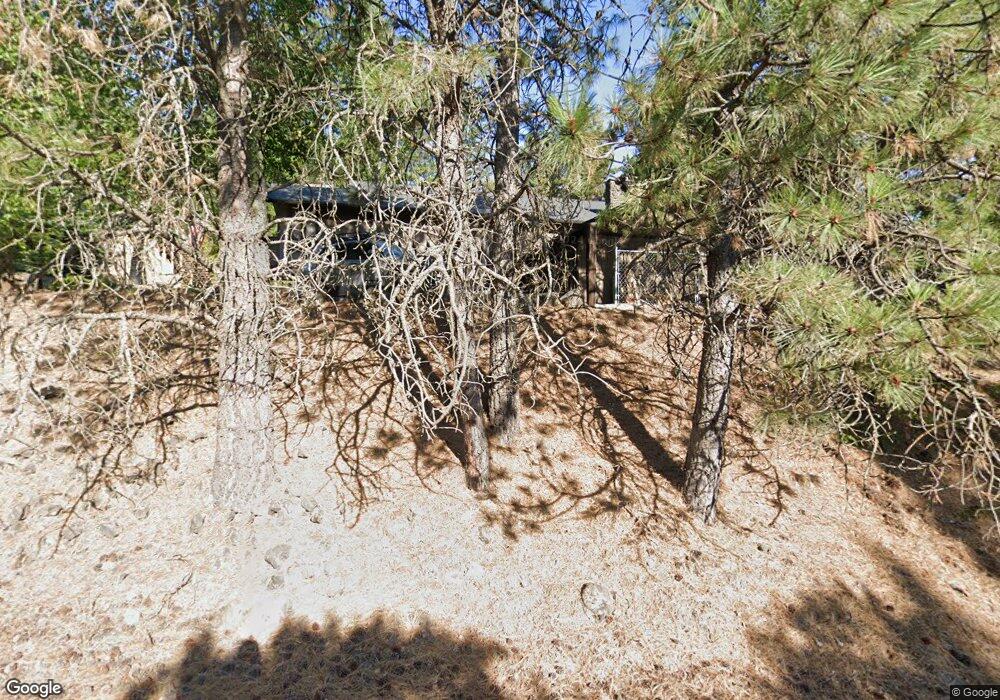
12820 E Apache Pass Rd Spokane, WA 99206
Chester NeighborhoodEstimated Value: $642,000 - $718,000
5
Beds
3
Baths
3,264
Sq Ft
$207/Sq Ft
Est. Value
About This Home
This home is located at 12820 E Apache Pass Rd, Spokane, WA 99206 and is currently estimated at $674,210, approximately $206 per square foot. 12820 E Apache Pass Rd is a home located in Spokane County with nearby schools including Chester Elementary School, Horizon Middle School, and Evergreen Middle School.
Ownership History
Date
Name
Owned For
Owner Type
Purchase Details
Closed on
Sep 25, 2008
Sold by
Babb Russell S and Babb Janna
Bought by
Bailey Samuel and Bailey Anne
Current Estimated Value
Home Financials for this Owner
Home Financials are based on the most recent Mortgage that was taken out on this home.
Original Mortgage
$306,450
Outstanding Balance
$203,783
Interest Rate
6.43%
Mortgage Type
VA
Estimated Equity
$470,427
Purchase Details
Closed on
Jun 27, 2005
Sold by
Brennan Larry R and Brennan Sharon K
Bought by
Babb Russell S and Babb Janna
Home Financials for this Owner
Home Financials are based on the most recent Mortgage that was taken out on this home.
Original Mortgage
$240,000
Interest Rate
5.65%
Mortgage Type
Balloon
Create a Home Valuation Report for This Property
The Home Valuation Report is an in-depth analysis detailing your home's value as well as a comparison with similar homes in the area
Home Values in the Area
Average Home Value in this Area
Purchase History
| Date | Buyer | Sale Price | Title Company |
|---|---|---|---|
| Bailey Samuel | $300,000 | First American Title Ins Co | |
| Babb Russell S | $300,000 | Transnation Title |
Source: Public Records
Mortgage History
| Date | Status | Borrower | Loan Amount |
|---|---|---|---|
| Open | Bailey Samuel | $306,450 | |
| Previous Owner | Babb Russell S | $240,000 |
Source: Public Records
Tax History
| Year | Tax Paid | Tax Assessment Tax Assessment Total Assessment is a certain percentage of the fair market value that is determined by local assessors to be the total taxable value of land and additions on the property. | Land | Improvement |
|---|---|---|---|---|
| 2025 | $6,224 | $625,780 | $169,380 | $456,400 |
| 2024 | $6,224 | $607,110 | $128,210 | $478,900 |
| 2023 | $4,868 | $564,420 | $118,220 | $446,200 |
| 2022 | $4,615 | $526,200 | $80,000 | $446,200 |
| 2021 | $4,259 | $360,300 | $55,000 | $305,300 |
| 2020 | $3,765 | $324,500 | $53,000 | $271,500 |
| 2019 | $3,303 | $289,900 | $56,700 | $233,200 |
| 2018 | $3,385 | $245,300 | $54,000 | $191,300 |
| 2017 | $3,337 | $245,300 | $54,000 | $191,300 |
| 2016 | $3,342 | $239,600 | $54,000 | $185,600 |
| 2015 | $3,211 | $233,100 | $43,200 | $189,900 |
| 2014 | -- | $239,600 | $54,000 | $185,600 |
| 2013 | -- | $0 | $0 | $0 |
Source: Public Records
Map
Nearby Homes
- 12704 E Apache Pass Rd
- 6134 S Zuni Dr
- 12720 E Kiowa Ct
- 6212 S Ranch Park Ln
- 6815 S Wilcox Ln
- 11823 E Honeycomb Springs Ln
- 11817 E Honeycomb Springs Ln
- 11811 E Honeycomb Springs Ln
- XXXX E View Ridge Ln
- 4718 S Lapwai Ln
- 13022 E San Juan Ln
- 12542 E Chester Ridge Ln Unit Lot 5
- 13010 E Chester Ridge Ln Unit Lot 9
- 13015 E Chester Ridge Ln Unit Lot 11
- 12616 E Chester Ridge Ln Unit Lot 6
- 13007 E Chester Ridge Ln Unit Lot 13
- 12712 E Chester Ridge Ln Unit Lot 7
- 12539 E Chester Ridge Ln Unit Lot 4
- 13014 E Chester Ridge Ln Unit Lot 10
- 13821 E Bellessa Ln
- 6011 S Lochsa Dr
- 12821 E Apache Pass Rd
- 6107 S Lochsa Dr
- 0 S Lochsa Dr
- 12821 E Apache Pass Rd
- 12905 E Apache Pass Rd
- 5915 S Lochsa Dr
- 0 S Zuni Dr
- 6104 S Lochsa Dr
- 6007 S Zuni Dr
- 5825 S Cree Dr
- 12808 E Apache Pass Rd
- 5824 S Cree Dr
- 12910 E Apache Pass Rd
- 5821 S Cree Dr
- 6117 S Eaglecrest Dr
- 6117 S Eagle Ln
- 5907 S Lochsa Dr
- 12915 E Apache Pass Rd
- 6102 S Eaglecrest Dr
Your Personal Tour Guide
Ask me questions while you tour the home.