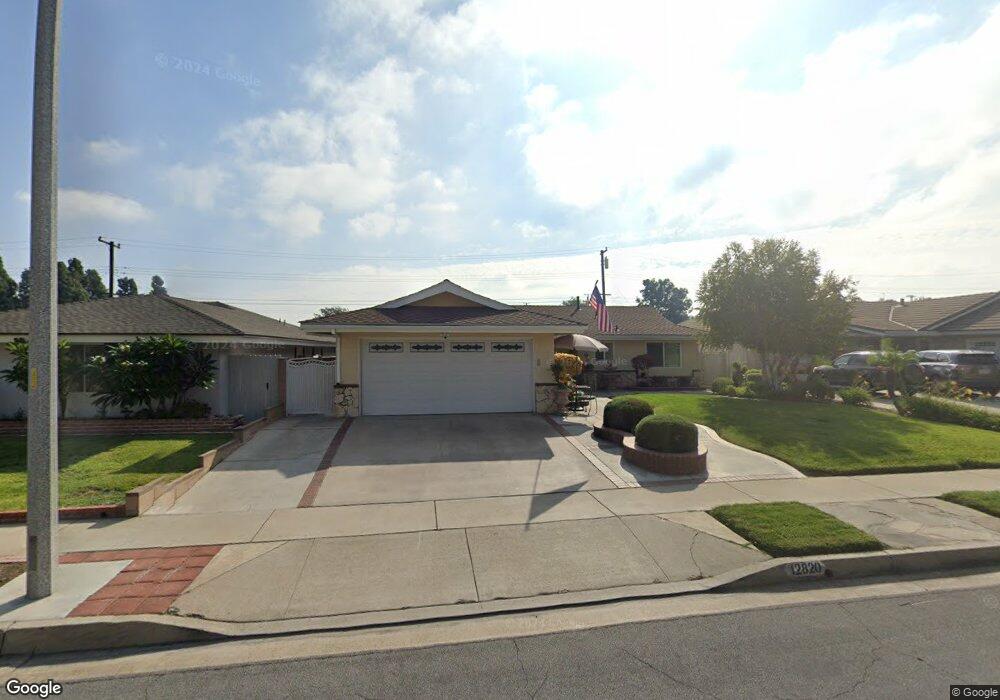
12820 Loganberry Dr La Mirada, CA 90638
Estimated Value: $978,000 - $1,160,000
4
Beds
2
Baths
1,906
Sq Ft
$554/Sq Ft
Est. Value
About This Home
This home is located at 12820 Loganberry Dr, La Mirada, CA 90638 and is currently estimated at $1,055,269, approximately $553 per square foot. 12820 Loganberry Dr is a home located in Los Angeles County with nearby schools including John Foster Dulles Elementary School, Reginald M. Benton Middle School, and La Mirada High School.
Ownership History
Date
Name
Owned For
Owner Type
Purchase Details
Closed on
Sep 4, 2024
Sold by
Rico Cesar I and Rico Linda Rae
Bought by
Interest Of The C & L Rico 2004 Family Trust and Rico
Current Estimated Value
Purchase Details
Closed on
Dec 14, 2005
Sold by
Rico Cesar I and Rico Linda Rae
Bought by
Rico Cesar I
Home Financials for this Owner
Home Financials are based on the most recent Mortgage that was taken out on this home.
Original Mortgage
$393,000
Interest Rate
6.36%
Mortgage Type
New Conventional
Purchase Details
Closed on
Apr 20, 2004
Sold by
Rico Cesar I and Rico Linda Rae
Bought by
Rico Cesar I
Purchase Details
Closed on
May 31, 2001
Sold by
Langbeen Julien H and Langbeen Gertrud
Bought by
Rico Cesar I
Home Financials for this Owner
Home Financials are based on the most recent Mortgage that was taken out on this home.
Original Mortgage
$220,000
Interest Rate
7.26%
Create a Home Valuation Report for This Property
The Home Valuation Report is an in-depth analysis detailing your home's value as well as a comparison with similar homes in the area
Home Values in the Area
Average Home Value in this Area
Purchase History
| Date | Buyer | Sale Price | Title Company |
|---|---|---|---|
| Interest Of The C & L Rico 2004 Family Trust | -- | None Listed On Document | |
| Rico Cesar I | -- | New Century Title Company | |
| Rico Cesar I | -- | -- | |
| Rico Cesar I | $275,000 | Benefit Land Title Company |
Source: Public Records
Mortgage History
| Date | Status | Borrower | Loan Amount |
|---|---|---|---|
| Previous Owner | Rico Cesar I | $393,000 | |
| Previous Owner | Rico Cesar I | $220,000 | |
| Closed | Rico Cesar I | $27,500 |
Source: Public Records
Tax History Compared to Growth
Tax History
| Year | Tax Paid | Tax Assessment Tax Assessment Total Assessment is a certain percentage of the fair market value that is determined by local assessors to be the total taxable value of land and additions on the property. | Land | Improvement |
|---|---|---|---|---|
| 2025 | $6,318 | $477,428 | $250,686 | $226,742 |
| 2024 | $6,318 | $468,068 | $245,771 | $222,297 |
| 2023 | $6,107 | $458,891 | $240,952 | $217,939 |
| 2022 | $5,183 | $382,806 | $236,228 | $146,578 |
| 2021 | $5,110 | $375,301 | $231,597 | $143,704 |
| 2019 | $4,967 | $364,172 | $224,729 | $139,443 |
| 2018 | $4,693 | $357,032 | $220,323 | $136,709 |
| 2016 | $4,499 | $343,169 | $211,768 | $131,401 |
| 2015 | $4,462 | $338,016 | $208,588 | $129,428 |
| 2014 | $4,155 | $331,396 | $204,503 | $126,893 |
Source: Public Records
Map
Nearby Homes
- 16344 Summershade Dr
- 12428 Grayling Ave
- 2541 W Cobblestone Rd
- 16415 Red Coach Ln
- 16501 Dundee Ct Unit 102
- 16411 Fitzpatrick Ct Unit 266
- 16521 Stonehaven Ct Unit 76
- 12020 Tigrina Ave
- 16330 Cameo Ct
- 16132 Landmark Dr
- 11932 Tigrina Ave
- 1130 Sturbridge Dr
- 16405 Visions Dr
- 16017 Red Coach Ln
- 16209 Eagleridge Ct
- 1961 W Snead St
- 12002 Grovedale Dr
- 12406 Clearglen Ave
- 11636 Tigrina Ave
- 13102 Avenue Santa Tecla
- 12814 Loganberry Dr
- 12808 Loganberry Dr
- 12832 Loganberry Dr
- 12826 Larrylyn Dr
- 12818 Spindlewood Dr
- 12812 Spindlewood Dr
- 12802 Loganberry Dr
- 12824 Spindlewood Dr
- 12816 Larrylyn Dr
- 12834 Larrylyn Dr
- 12840 Loganberry Dr
- 12806 Spindlewood Dr
- 12810 Larrylyn Dr
- 12830 Spindlewood Dr
- 12840 Larrylyn Dr
- 12734 Loganberry Dr
- 12802 Larrylyn Dr
- 16514 Cobblestone Rd
- 12802 Spindlewood Dr
- 16515 Cobblestone Rd