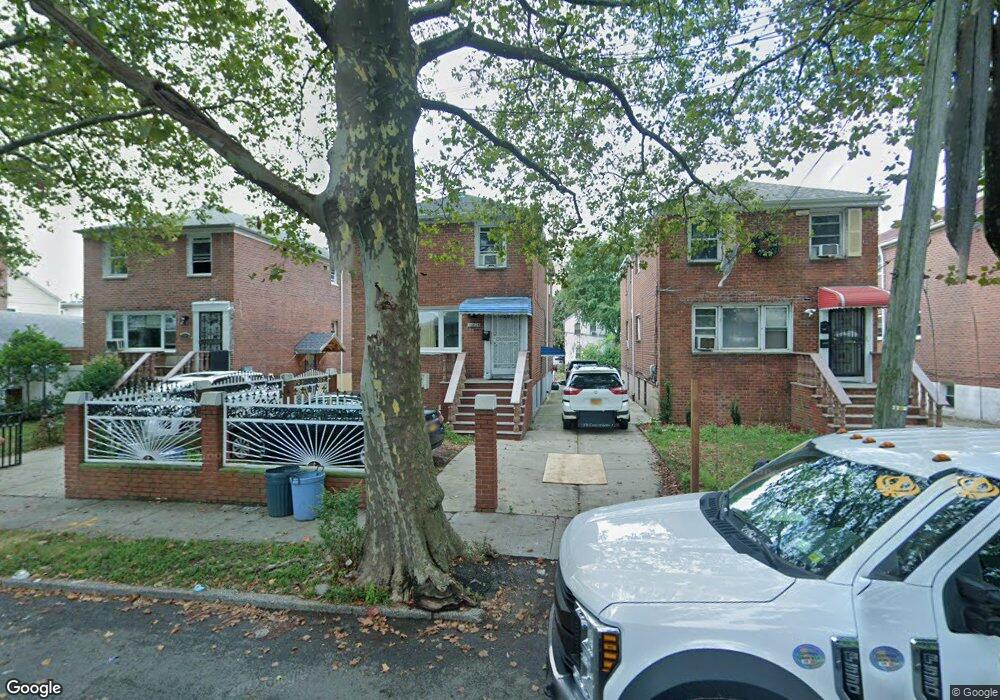
12824 van Wyck Expy South Ozone Park, NY 11420
South Ozone Park NeighborhoodEstimated Value: $946,000 - $1,169,000
--
Bed
--
Bath
2,760
Sq Ft
$370/Sq Ft
Est. Value
About This Home
This home is located at 12824 van Wyck Expy, South Ozone Park, NY 11420 and is currently estimated at $1,020,787, approximately $369 per square foot. 12824 van Wyck Expy is a home located in Queens County with nearby schools including Ps 124 Osmond A Church, J.H.S. 226 Virgil I. Grisson, and John Adams High School.
Ownership History
Date
Name
Owned For
Owner Type
Purchase Details
Closed on
Dec 30, 2021
Sold by
Boodhoo Ritwantie and Haripersaud Mahendra
Bought by
128-24 Builders Llc
Current Estimated Value
Home Financials for this Owner
Home Financials are based on the most recent Mortgage that was taken out on this home.
Original Mortgage
$546,000
Interest Rate
3.92%
Mortgage Type
Purchase Money Mortgage
Purchase Details
Closed on
Sep 20, 2002
Sold by
Hernandez Saul Perez and Perez Angela Karin
Bought by
Haripersaud Mahendra and Boodho Ritwantie
Home Financials for this Owner
Home Financials are based on the most recent Mortgage that was taken out on this home.
Original Mortgage
$331,194
Interest Rate
6.09%
Purchase Details
Closed on
Jan 20, 2000
Sold by
Bulzone Carol and Bulzone Constance
Bought by
Hernandez Saul Perez and Perez Angela Karin
Home Financials for this Owner
Home Financials are based on the most recent Mortgage that was taken out on this home.
Original Mortgage
$273,000
Interest Rate
7.98%
Mortgage Type
FHA
Create a Home Valuation Report for This Property
The Home Valuation Report is an in-depth analysis detailing your home's value as well as a comparison with similar homes in the area
Home Values in the Area
Average Home Value in this Area
Purchase History
| Date | Buyer | Sale Price | Title Company |
|---|---|---|---|
| 128-24 Builders Llc | $840,000 | -- | |
| Haripersaud Mahendra | -- | -- | |
| Hernandez Saul Perez | $275,000 | Advantage Title |
Source: Public Records
Mortgage History
| Date | Status | Borrower | Loan Amount |
|---|---|---|---|
| Previous Owner | 128-24 Builders Llc | $546,000 | |
| Previous Owner | Haripersaud Mahendra | $331,194 | |
| Previous Owner | Hernandez Saul Perez | $273,000 |
Source: Public Records
Tax History Compared to Growth
Tax History
| Year | Tax Paid | Tax Assessment Tax Assessment Total Assessment is a certain percentage of the fair market value that is determined by local assessors to be the total taxable value of land and additions on the property. | Land | Improvement |
|---|---|---|---|---|
| 2025 | $7,115 | $37,549 | $5,023 | $32,526 |
| 2024 | $7,115 | $35,424 | $5,679 | $29,745 |
| 2023 | $7,115 | $35,424 | $4,794 | $30,630 |
| 2022 | $6,865 | $54,960 | $8,340 | $46,620 |
| 2021 | $6,980 | $45,540 | $8,340 | $37,200 |
| 2020 | $6,623 | $45,480 | $8,340 | $37,140 |
| 2019 | $6,175 | $38,940 | $8,340 | $30,600 |
| 2018 | $6,018 | $29,520 | $6,943 | $22,577 |
| 2017 | $5,842 | $28,656 | $6,312 | $22,344 |
| 2016 | $5,526 | $28,656 | $6,312 | $22,344 |
| 2015 | $3,041 | $26,076 | $7,791 | $18,285 |
| 2014 | $3,041 | $24,600 | $8,820 | $15,780 |
Source: Public Records
Map
Nearby Homes
- 129-13 135th Place
- 129-28 135th Place
- 137-04 130th Ave
- 135-40 Alwick Rd
- 12940 135th St
- 13410 Sutter Ave
- 129-55 134th St
- 123-45 135th St
- 12321 135th St
- 131-10 134th St
- 13116 140th St
- 13121 133rd St
- 141-08 Rockaway Blvd
- 132-01 131st Ave
- 13327 135th Place
- 14225 Sutter Ave
- 13111 142nd St
- 120-56 132nd St
- 14235 Sutter Ave
- 14234 Bascom Ave
- 128-24 van Wyck Expy
- 12820 van Wyck Expy
- 12828 van Wyck Expy
- 12828 van Wyck Expy
- 128-28 van Wyck Expy
- 12818 van Wyck Expy
- 128-18 van Wyck Expy
- 13543 130th Ave
- 12921 135th Place
- 12923 135th Place
- 12919 135th Place
- 12814 van Wyck Expy
- 13541 130th Ave
- 12925 135th Place
- 12917 135th Place
- 13537 130th Ave
- 12915 135th Place
- 12927 135th Place
- 13537 130th Ave
- 12929 135th Place