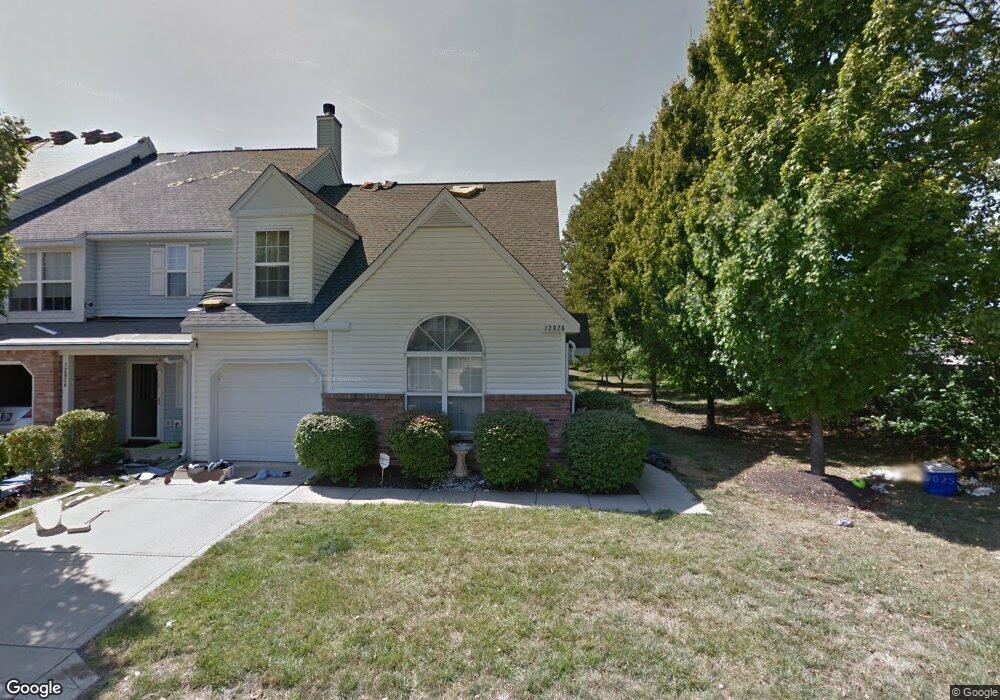
12826 Boone St Unit 3 Fishers, IN 46038
Estimated Value: $254,000 - $278,000
3
Beds
2
Baths
1,904
Sq Ft
$138/Sq Ft
Est. Value
About This Home
This home is located at 12826 Boone St Unit 3, Fishers, IN 46038 and is currently estimated at $262,919, approximately $138 per square foot. 12826 Boone St Unit 3 is a home located in Hamilton County with nearby schools including Cumberland Road Elementary School, East Middle School, and Fishers Junior High School.
Ownership History
Date
Name
Owned For
Owner Type
Purchase Details
Closed on
Sep 8, 2021
Sold by
Swetnam Tasha F
Bought by
Madani Taranae Mary
Current Estimated Value
Home Financials for this Owner
Home Financials are based on the most recent Mortgage that was taken out on this home.
Original Mortgage
$199,500
Outstanding Balance
$181,530
Interest Rate
2.8%
Mortgage Type
New Conventional
Estimated Equity
$81,389
Purchase Details
Closed on
Dec 5, 2017
Sold by
Mn Holdings Llc
Bought by
Swetnam Tasha F
Home Financials for this Owner
Home Financials are based on the most recent Mortgage that was taken out on this home.
Original Mortgage
$99,000
Interest Rate
3.94%
Mortgage Type
New Conventional
Purchase Details
Closed on
Sep 14, 2017
Sold by
Burks Troy P and Carrington Mortgage Services L
Bought by
Mnc Holding Llc
Purchase Details
Closed on
Nov 25, 2008
Sold by
Comer Kimberly A and Vannatta Ryan
Bought by
Burks Troy P
Home Financials for this Owner
Home Financials are based on the most recent Mortgage that was taken out on this home.
Original Mortgage
$106,810
Interest Rate
6.04%
Mortgage Type
FHA
Create a Home Valuation Report for This Property
The Home Valuation Report is an in-depth analysis detailing your home's value as well as a comparison with similar homes in the area
Home Values in the Area
Average Home Value in this Area
Purchase History
| Date | Buyer | Sale Price | Title Company |
|---|---|---|---|
| Madani Taranae Mary | $2,175 | Landquest Title Group Llc | |
| Swetnam Tasha F | -- | None Available | |
| Mnc Holding Llc | $100,100 | None Available | |
| Burks Troy P | -- | None Available |
Source: Public Records
Mortgage History
| Date | Status | Borrower | Loan Amount |
|---|---|---|---|
| Open | Madani Taranae Mary | $199,500 | |
| Previous Owner | Swetnam Tasha F | $99,000 | |
| Previous Owner | Burks Troy P | $106,810 |
Source: Public Records
Tax History Compared to Growth
Tax History
| Year | Tax Paid | Tax Assessment Tax Assessment Total Assessment is a certain percentage of the fair market value that is determined by local assessors to be the total taxable value of land and additions on the property. | Land | Improvement |
|---|---|---|---|---|
| 2024 | $2,332 | $228,300 | $68,000 | $160,300 |
| 2023 | $2,332 | $224,200 | $45,000 | $179,200 |
| 2022 | $1,712 | $188,500 | $45,000 | $143,500 |
| 2021 | $1,712 | $164,700 | $33,000 | $131,700 |
| 2020 | $3,507 | $151,700 | $33,000 | $118,700 |
| 2019 | $3,289 | $141,500 | $24,300 | $117,200 |
| 2018 | $3,001 | $129,300 | $24,300 | $105,000 |
| 2017 | $2,869 | $124,800 | $24,300 | $100,500 |
| 2016 | $2,779 | $121,600 | $24,300 | $97,300 |
| 2014 | $843 | $109,600 | $24,300 | $85,300 |
| 2013 | $843 | $112,500 | $24,300 | $88,200 |
Source: Public Records
Map
Nearby Homes
- 12959 Shandon Ln
- 12677 Ladson St
- 12991 Wingstem Ct
- 11798 & 11842 E 131st St
- 10066 Perlita Place
- 13068 Lamarque Place
- 10150 Beresford Ct
- 9080 Teaneck Dr
- 9050 Sparta Dr
- 13068 Raritan Dr
- 13125 Zinfandel Place
- 9009 Mercer Dr
- 13048 Ross Crossing
- 12966 Pleasant View Ln
- 10175 Pamona Ct
- 12541 Trester Ln
- 8850 Tanner Dr
- 10671 Pleasant View Ln
- 12587 Wolford Place
- 9335 Clarendon Dr
- 12826 Boone St
- 12824 Boone St
- 12824 Boone St Unit 1803
- 12822 Boone St
- 12822 Boone St Unit 18
- 12822 Boone St Unit 111802
- 12817 Lamboll St
- 12817 Lamboll St Unit 17
- 12820 Boone St
- 12914 Saint Andrews Way
- 12825 Boone St
- 12813 Lamboll St
- 12813 Lamboll St Unit 18
- 12823 Boone St
- 12823 Boone St Unit 1902
- 12916 Saint Andrews Way
- 12912 Saint Andrews Way
- 12821 Boone St
- 12916 St Andrews Wa
- 12811 Lamboll St