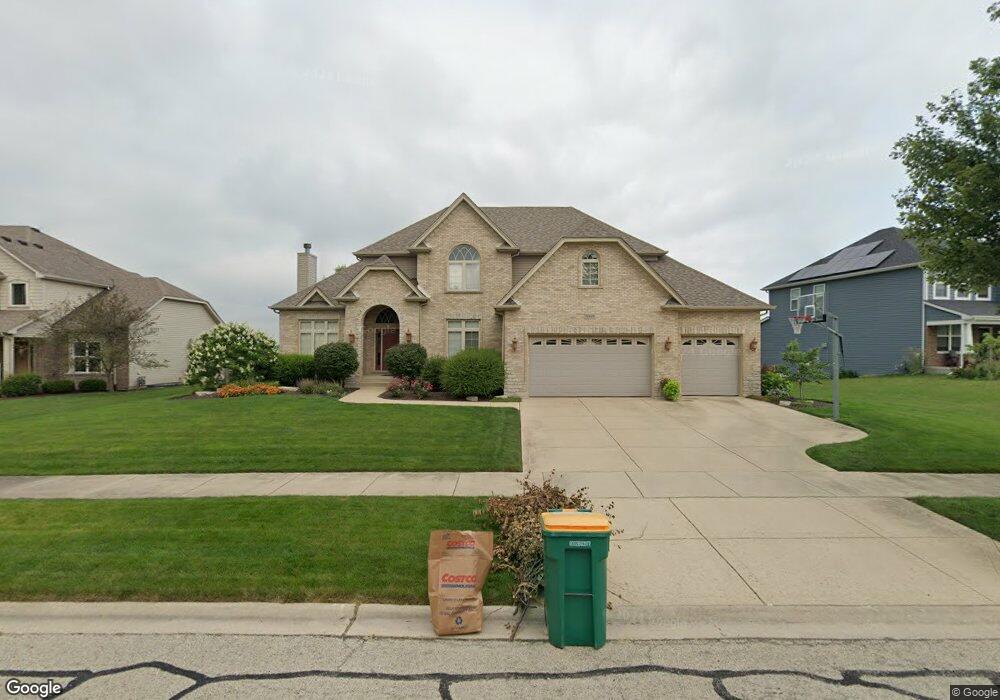
12828 Ridge Wood Ln Plainfield, IL 60585
Grande Park NeighborhoodEstimated Value: $637,000 - $691,000
4
Beds
4
Baths
3,104
Sq Ft
$213/Sq Ft
Est. Value
About This Home
This home is located at 12828 Ridge Wood Ln, Plainfield, IL 60585 and is currently estimated at $662,289, approximately $213 per square foot. 12828 Ridge Wood Ln is a home located in Kendall County with nearby schools including Grande Park Elementary School, Murphy Junior High School, and Oswego East High School.
Ownership History
Date
Name
Owned For
Owner Type
Purchase Details
Closed on
May 15, 2019
Sold by
Tyburski Kevin J and Nguyen Tyburski Amanda D
Bought by
Nguyen Tyburski Amanda D
Current Estimated Value
Purchase Details
Closed on
Aug 8, 2007
Sold by
Pushic Enterprises Inc
Bought by
Tyburski Kevin J and Nguyen Tyburski Amanda D
Home Financials for this Owner
Home Financials are based on the most recent Mortgage that was taken out on this home.
Original Mortgage
$250,000
Outstanding Balance
$158,692
Interest Rate
6.71%
Mortgage Type
Purchase Money Mortgage
Estimated Equity
$503,597
Purchase Details
Closed on
Aug 17, 2006
Sold by
Mpi-1 Plainfield West Llc
Bought by
Pushic Enterprises Inc
Home Financials for this Owner
Home Financials are based on the most recent Mortgage that was taken out on this home.
Original Mortgage
$90,000
Interest Rate
8.25%
Mortgage Type
Purchase Money Mortgage
Create a Home Valuation Report for This Property
The Home Valuation Report is an in-depth analysis detailing your home's value as well as a comparison with similar homes in the area
Home Values in the Area
Average Home Value in this Area
Purchase History
| Date | Buyer | Sale Price | Title Company |
|---|---|---|---|
| Nguyen Tyburski Amanda D | -- | Attorney | |
| Tyburski Kevin J | $482,500 | None Available | |
| Pushic Enterprises Inc | $121,000 | Chicago Title Insurance Co |
Source: Public Records
Mortgage History
| Date | Status | Borrower | Loan Amount |
|---|---|---|---|
| Open | Tyburski Kevin J | $250,000 | |
| Previous Owner | Pushic Enterprises Inc | $90,000 |
Source: Public Records
Tax History Compared to Growth
Tax History
| Year | Tax Paid | Tax Assessment Tax Assessment Total Assessment is a certain percentage of the fair market value that is determined by local assessors to be the total taxable value of land and additions on the property. | Land | Improvement |
|---|---|---|---|---|
| 2024 | $15,851 | $195,643 | $32,034 | $163,609 |
| 2023 | $14,290 | $173,136 | $28,349 | $144,787 |
| 2022 | $14,290 | $158,840 | $26,008 | $132,832 |
| 2021 | $13,780 | $148,449 | $24,307 | $124,142 |
| 2020 | $13,488 | $144,125 | $23,599 | $120,526 |
| 2019 | $13,694 | $144,125 | $23,599 | $120,526 |
| 2018 | $12,688 | $133,140 | $21,800 | $111,340 |
| 2017 | $12,270 | $122,147 | $20,000 | $102,147 |
| 2016 | $14,084 | $137,453 | $28,870 | $108,583 |
| 2015 | $13,740 | $128,460 | $26,981 | $101,479 |
| 2014 | -- | $132,433 | $27,815 | $104,618 |
| 2013 | -- | $120,393 | $25,286 | $95,107 |
Source: Public Records
Map
Nearby Homes
- 12908 Timber Wood Cir
- 870 Simons Rd
- 12903 Cypress Ln
- 5291 S Ridge Rd
- 12922 Grande Poplar Cir
- 27107 Thornwood Blvd
- 12802 Grande Poplar Cir
- 26800 Basswood Cir
- 13035 Grande Pines Blvd
- 26543 W Countryside Ln
- 26640 Lindengate Cir
- 12929 Alpine Way
- 12501 S Willowgate Ln
- 26315 Elizabeth Ct
- 26414 Rustling Birch Way
- 1481B Collins Rd
- 12354 S Blue Water Pkwy
- 26307 Whispering Woods Ct
- 26200 W Chatham Dr
- 12305 S Prairie Ridge Ln
- 12824 Ridge Wood Ln
- 12832 Ridge Wood Ln
- 0 Peppertree Dr
- 0 Peppertree Dr Unit 9570407
- 12917 Timber Wood Cir
- 12919 Timber Wood Cir
- 12820 Ridge Wood Ln
- 12915 Timber Wood Cir
- 12829 Ridge Wood Ln
- 12825 Ridge Wood Ln
- 12831 Peppertree Dr
- 12902 Ridge Wood Ln
- 12913 Timber Wood Cir
- 12821 Ridge Wood Ln
- 12821 Ridge Wood Lot108 Ln
- 12816 Ridge Wood Ln
- 12911 Timber Wood Cir
- 12817 Ridge Wood Ln
- 12921 Timber Wood Cir
- 12832 Peppertree Dr