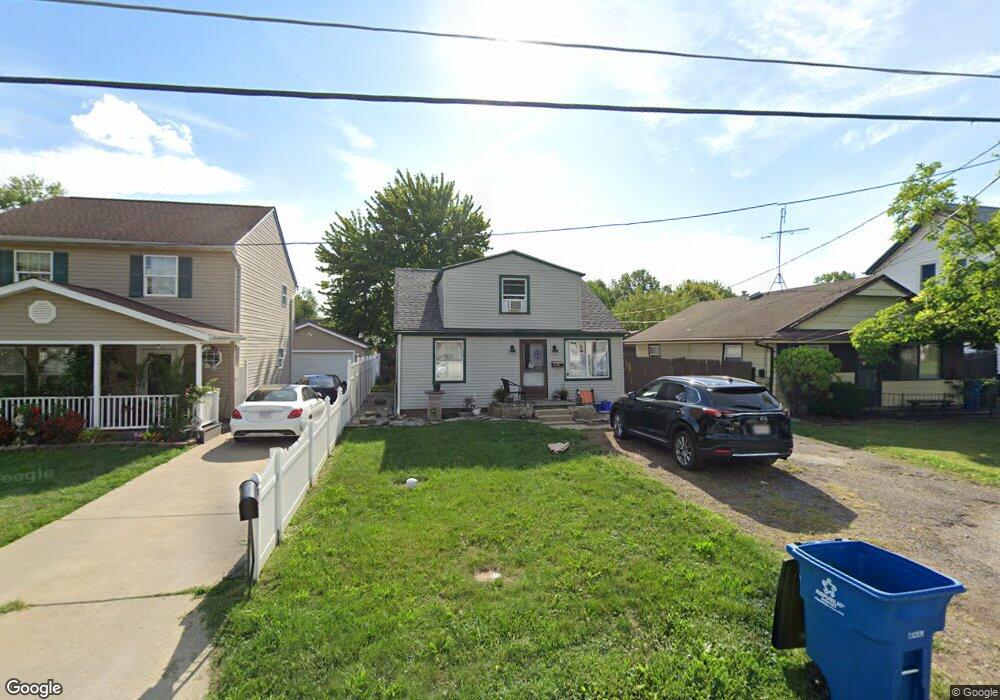
1283 E 348th St Eastlake, OH 44095
Estimated Value: $160,000 - $178,000
3
Beds
2
Baths
1,075
Sq Ft
$158/Sq Ft
Est. Value
About This Home
This home is located at 1283 E 348th St, Eastlake, OH 44095 and is currently estimated at $169,556, approximately $157 per square foot. 1283 E 348th St is a home located in Lake County with nearby schools including Longfellow Elementary School, Eastlake Middle School, and North High School.
Ownership History
Date
Name
Owned For
Owner Type
Purchase Details
Closed on
Apr 21, 2010
Sold by
Damron Arthur L and Moses Sylvia A
Bought by
Moses Sylvia A and Damron Arthur
Current Estimated Value
Purchase Details
Closed on
Jul 19, 1999
Sold by
Stimbury Roy and Stimburys Roy
Bought by
Moses Sylvia A
Home Financials for this Owner
Home Financials are based on the most recent Mortgage that was taken out on this home.
Original Mortgage
$86,196
Outstanding Balance
$23,157
Interest Rate
7.77%
Mortgage Type
FHA
Estimated Equity
$146,399
Purchase Details
Closed on
Jan 27, 1999
Sold by
Steudel Richard A
Bought by
Stimburys Roy
Purchase Details
Closed on
Jan 25, 1999
Sold by
Stimbury Roy and Stimburys Roy
Bought by
Steudel Richard A
Purchase Details
Closed on
Aug 30, 1996
Sold by
Bcgs Llc
Bought by
Stimbury Roy
Create a Home Valuation Report for This Property
The Home Valuation Report is an in-depth analysis detailing your home's value as well as a comparison with similar homes in the area
Home Values in the Area
Average Home Value in this Area
Purchase History
| Date | Buyer | Sale Price | Title Company |
|---|---|---|---|
| Moses Sylvia A | -- | None Available | |
| Moses Sylvia A | $87,000 | Continental Title Agency Cor | |
| Stimburys Roy | -- | Continental Title Agency Cor | |
| Steudel Richard A | -- | Continental Title Agency Cor | |
| Stimbury Roy | $56,000 | -- |
Source: Public Records
Mortgage History
| Date | Status | Borrower | Loan Amount |
|---|---|---|---|
| Open | Moses Sylvia A | $86,196 |
Source: Public Records
Tax History
| Year | Tax Paid | Tax Assessment Tax Assessment Total Assessment is a certain percentage of the fair market value that is determined by local assessors to be the total taxable value of land and additions on the property. | Land | Improvement |
|---|---|---|---|---|
| 2025 | $1,670 | $54,270 | $9,260 | $45,010 |
| 2024 | $1,598 | $54,270 | $9,260 | $45,010 |
| 2023 | $1,598 | $42,320 | $7,960 | $34,360 |
| 2022 | $2,721 | $42,320 | $7,960 | $34,360 |
| 2021 | $2,733 | $42,320 | $7,960 | $34,360 |
| 2020 | $2,463 | $33,850 | $6,360 | $27,490 |
| 2019 | $2,293 | $33,850 | $6,360 | $27,490 |
| 2018 | $2,210 | $30,290 | $10,890 | $19,400 |
| 2017 | $2,156 | $30,290 | $10,890 | $19,400 |
| 2016 | $2,015 | $30,290 | $10,890 | $19,400 |
| 2015 | $1,967 | $30,290 | $10,890 | $19,400 |
| 2014 | $1,865 | $30,290 | $10,890 | $19,400 |
| 2013 | $1,866 | $30,290 | $10,890 | $19,400 |
Source: Public Records
Map
Nearby Homes
- 1312 E 349th St
- 1301 E 346th St
- 1334 E 346th St
- 1262 E 346th St
- 1342 E 346th St
- 1259 E 351st St
- 1222 E 360th St
- 400 Taft Dr
- 1313 Waverly Rd
- 0 E 362nd St
- 1344 Waverly Rd
- 1085 Stevens Blvd
- 1096 Stevens Blvd
- 36405 Stevens Blvd
- 35477 Hobbie Dr
- 483 E 330th St
- 36001 Freed Ct
- 1138 E 331st St
- 33072 Edward Ave
- 201 Taft Dr
- 1287 E 348th St
- 1277 E 348th St
- 1291 E 348th St
- 1273 E 348th St
- 1269 E 348th St
- 1282 E 349th St
- 1276 E 349th St
- 1286 E 349th St
- 1297 E 348th St
- 1272 E 349th St
- 1263 E 348th St
- 1264 E 349th St
- 1284 E 348th St
- 1296 E 349th St
- 1288 E 348th St
- 1276 E 348th St
- 1292 E 348th St
- 1305 E 348th St
- 1302 E 349th St
- 1298 E 348th St
Your Personal Tour Guide
Ask me questions while you tour the home.