Estimated Value: $163,000 - $196,000
3
Beds
1
Bath
864
Sq Ft
$201/Sq Ft
Est. Value
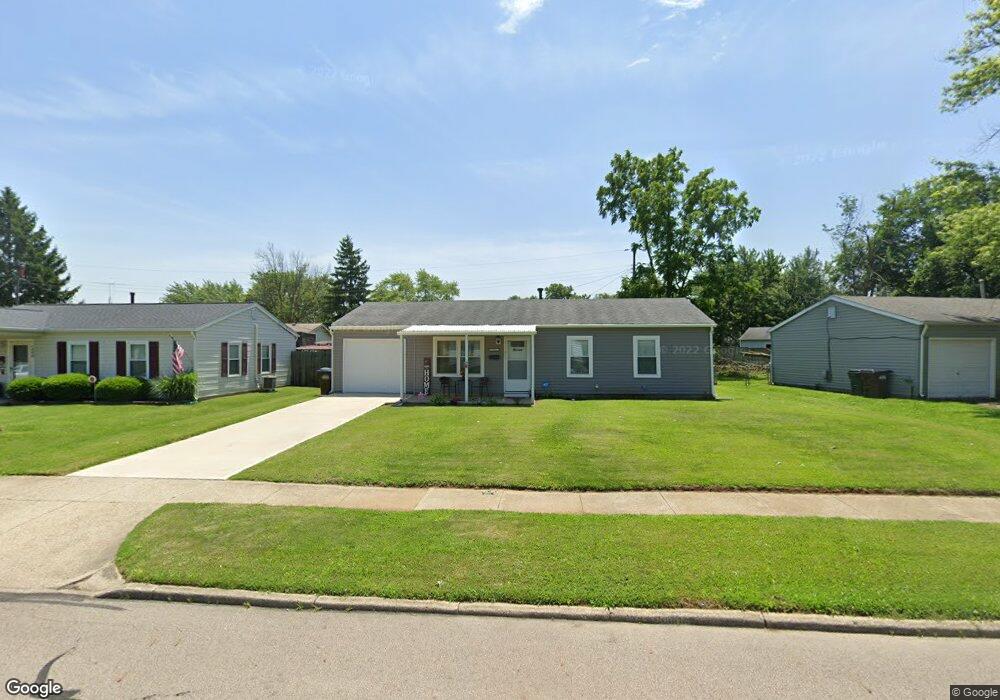
About This Home
This home is located at 1283 Glover Dr, Xenia, OH 45385 and is currently estimated at $173,236, approximately $200 per square foot. 1283 Glover Dr is a home located in Greene County with nearby schools including Xenia High School, Summit Academy Community School for Alternative Learners - Xenia, and Legacy Christian Academy.
Ownership History
Date
Name
Owned For
Owner Type
Purchase Details
Closed on
Nov 20, 2019
Sold by
Kimike Properties Llc
Bought by
Scott Gloria J
Current Estimated Value
Home Financials for this Owner
Home Financials are based on the most recent Mortgage that was taken out on this home.
Original Mortgage
$112,769
Outstanding Balance
$99,502
Interest Rate
3.75%
Mortgage Type
FHA
Estimated Equity
$73,734
Purchase Details
Closed on
Mar 27, 2019
Sold by
U S Bank Trust National Association
Bought by
Kimike Properties Llc
Purchase Details
Closed on
Nov 19, 2018
Sold by
Shackleford Lola Ann
Bought by
U S Bank Trust Na and American Homeowner Preservation Trust
Create a Home Valuation Report for This Property
The Home Valuation Report is an in-depth analysis detailing your home's value as well as a comparison with similar homes in the area
Home Values in the Area
Average Home Value in this Area
Purchase History
| Date | Buyer | Sale Price | Title Company |
|---|---|---|---|
| Scott Gloria J | $114,900 | None Available | |
| Kimike Properties Llc | $39,500 | None Available | |
| U S Bank Trust Na | $34,000 | None Available |
Source: Public Records
Mortgage History
| Date | Status | Borrower | Loan Amount |
|---|---|---|---|
| Open | Scott Gloria J | $112,769 |
Source: Public Records
Tax History Compared to Growth
Tax History
| Year | Tax Paid | Tax Assessment Tax Assessment Total Assessment is a certain percentage of the fair market value that is determined by local assessors to be the total taxable value of land and additions on the property. | Land | Improvement |
|---|---|---|---|---|
| 2024 | $1,476 | $45,190 | $9,170 | $36,020 |
| 2023 | $1,476 | $45,190 | $9,170 | $36,020 |
| 2022 | $1,537 | $31,430 | $6,550 | $24,880 |
| 2021 | $1,558 | $31,430 | $6,550 | $24,880 |
| 2020 | $1,491 | $31,430 | $6,550 | $24,880 |
| 2019 | $1,208 | $23,360 | $4,550 | $18,810 |
| 2018 | $1,763 | $23,360 | $4,550 | $18,810 |
| 2017 | $1,583 | $23,360 | $4,550 | $18,810 |
| 2016 | $1,165 | $22,000 | $4,550 | $17,450 |
| 2015 | $1,168 | $22,000 | $4,550 | $17,450 |
| 2014 | $1,118 | $22,000 | $4,550 | $17,450 |
Source: Public Records
Map
Nearby Homes
- 1351 Omard Dr
- 343 Sheelin Rd
- 912 Omard Dr
- 883 Omard Dr
- 1391 June Dr
- 1283 June Dr
- 1233 June Dr
- 1223 June Dr
- 509 Antrim Rd
- 1342 Kylemore Dr
- 121 S Progress Dr
- 1144 Rockwell Dr
- 613 N West St
- Harmony Plan at Grandstone Trace
- Newcastle Plan at Grandstone Trace
- Pendleton Plan at Grandstone Trace
- Bellamy Plan at Grandstone Trace
- Chatham Plan at Grandstone Trace
- 523 Hollywood Blvd
- 305-325 Bellbrook Ave