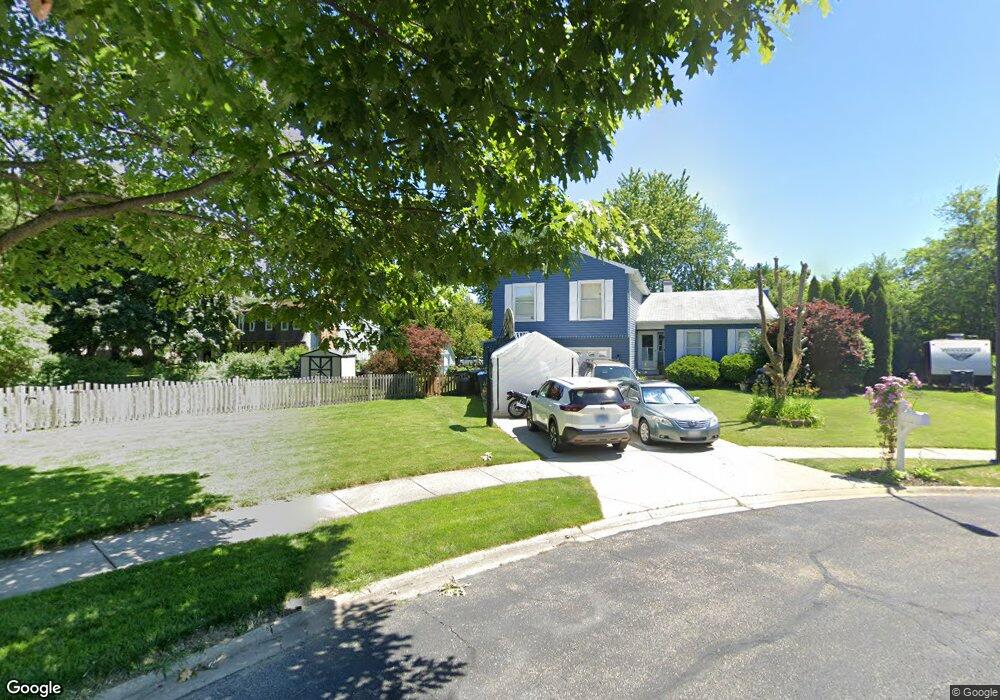
1283 Meyer Ct Unit 1 Naperville, IL 60564
Springbrook Prairie NeighborhoodEstimated Value: $456,502 - $534,000
--
Bed
1
Bath
1,806
Sq Ft
$274/Sq Ft
Est. Value
About This Home
This home is located at 1283 Meyer Ct Unit 1, Naperville, IL 60564 and is currently estimated at $495,126, approximately $274 per square foot. 1283 Meyer Ct Unit 1 is a home located in Will County with nearby schools including Robert Clow Elementary School, Ellsworth Elementary School, and Gordon Gregory Middle School.
Ownership History
Date
Name
Owned For
Owner Type
Purchase Details
Closed on
May 12, 2003
Sold by
Villa Francisco
Bought by
Villa Francisco and Villa Elizabeth
Current Estimated Value
Home Financials for this Owner
Home Financials are based on the most recent Mortgage that was taken out on this home.
Original Mortgage
$101,000
Interest Rate
5.95%
Mortgage Type
Purchase Money Mortgage
Purchase Details
Closed on
Aug 7, 1996
Sold by
Baker Denis L and Baker Amy J
Bought by
Villa Prancisco
Home Financials for this Owner
Home Financials are based on the most recent Mortgage that was taken out on this home.
Original Mortgage
$124,000
Interest Rate
8.29%
Mortgage Type
Balloon
Purchase Details
Closed on
Jun 9, 1995
Sold by
Ranch Jr Robert B and Ranch Catherine H
Bought by
Baker Denis L and Baker Amy J
Home Financials for this Owner
Home Financials are based on the most recent Mortgage that was taken out on this home.
Original Mortgage
$137,520
Interest Rate
8.26%
Create a Home Valuation Report for This Property
The Home Valuation Report is an in-depth analysis detailing your home's value as well as a comparison with similar homes in the area
Home Values in the Area
Average Home Value in this Area
Purchase History
| Date | Buyer | Sale Price | Title Company |
|---|---|---|---|
| Villa Francisco | -- | First American Title Ins Co | |
| Villa Prancisco | $183,000 | -- | |
| Baker Denis L | $172,000 | Collar Counties Title Plant |
Source: Public Records
Mortgage History
| Date | Status | Borrower | Loan Amount |
|---|---|---|---|
| Closed | Villa Francisco | $101,000 | |
| Closed | Villa Prancisco | $124,000 | |
| Previous Owner | Baker Denis L | $137,520 |
Source: Public Records
Tax History Compared to Growth
Tax History
| Year | Tax Paid | Tax Assessment Tax Assessment Total Assessment is a certain percentage of the fair market value that is determined by local assessors to be the total taxable value of land and additions on the property. | Land | Improvement |
|---|---|---|---|---|
| 2024 | $8,103 | $131,717 | $36,274 | $95,443 |
| 2023 | $8,103 | $116,358 | $32,044 | $84,314 |
| 2022 | $7,474 | $109,158 | $30,312 | $78,846 |
| 2021 | $7,136 | $103,960 | $28,869 | $75,091 |
| 2020 | $6,997 | $102,313 | $28,412 | $73,901 |
| 2019 | $6,872 | $99,429 | $27,611 | $71,818 |
| 2018 | $6,795 | $96,713 | $27,003 | $69,710 |
| 2017 | $6,687 | $94,216 | $26,306 | $67,910 |
| 2016 | $6,670 | $92,188 | $25,740 | $66,448 |
| 2015 | $6,870 | $88,642 | $24,750 | $63,892 |
| 2014 | $6,870 | $88,145 | $24,750 | $63,395 |
| 2013 | $6,870 | $88,145 | $24,750 | $63,395 |
Source: Public Records
Map
Nearby Homes
- 1329 Neskola Ct
- 1321 Galena Ct
- 2301 Mecan Dr
- 2224 Flambeau Dr
- 1305 Morningstar Ct Unit 1A
- 1134 Gateshead Dr
- 28W555 Leverenz Rd
- 2636 Salix Cir
- 2741 Gateshead Dr
- 1123 Thackery Ln
- 3004 Bennett Dr
- 567 Roxbury Dr
- 2949 Brossman St
- 3212 Austin Ct
- 2206 Gleneagles Dr
- 2207 Sisters Ave
- 2203 Fox Boro Ln
- 945 Winners Cup Ct Unit 945
- 2543 Dewes Ln
- 1116 Hollingswood Ave
- 1280 Meyer Ct
- 1287 Meyer Ct
- 10S268 Meadow Ln
- 28W205 Lakeview Dr
- 1282 Meyer Ct
- 1291 Meyer Ct
- 10S256 Meadow Ln
- 1286 Meyer Ct
- 28W172 Lakeview Dr
- 2324 Flambeau Dr
- 28W165 Lakeview Dr
- 1290 Meyer Ct
- 2328 Flambeau Dr
- 2320 Flambeau Dr
- 10S240 Meadow Ln Unit 5
- 10S243 Meadow Ln
- 28W153 Lakeview Dr
- 1259 Leverenz Rd
- 28W166 Lakeview Dr
- 1255 Leverenz Rd