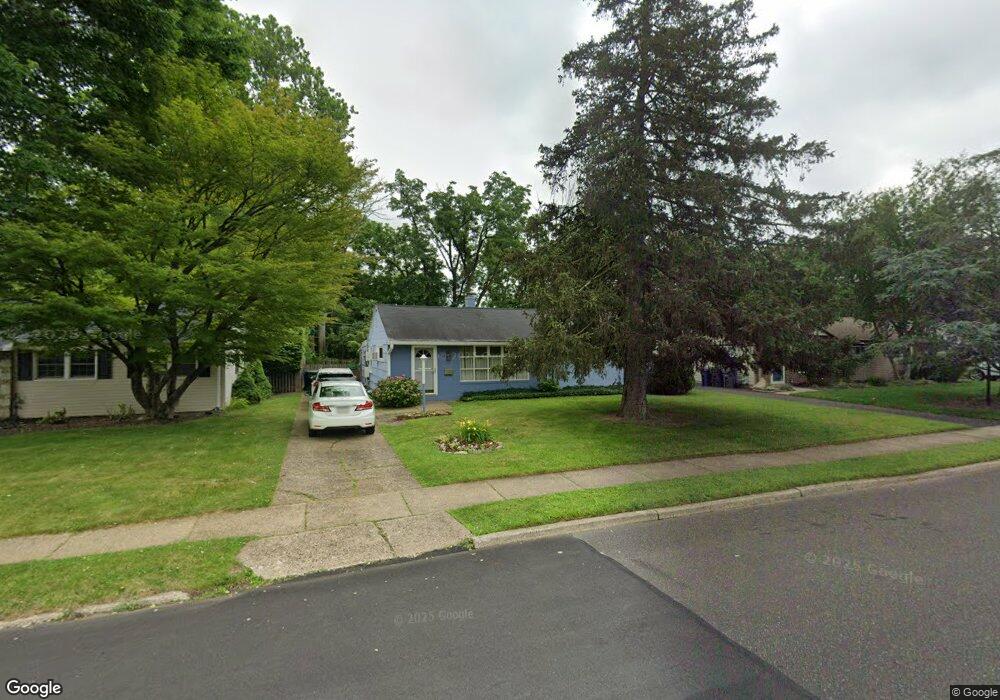
1283 Thompson Rd Abington, PA 19001
Estimated Value: $393,368 - $421,000
3
Beds
2
Baths
1,730
Sq Ft
$236/Sq Ft
Est. Value
About This Home
This home is located at 1283 Thompson Rd, Abington, PA 19001 and is currently estimated at $408,592, approximately $236 per square foot. 1283 Thompson Rd is a home located in Montgomery County with nearby schools including Roslyn School, Abington Middle School, and Abington Senior High School.
Ownership History
Date
Name
Owned For
Owner Type
Purchase Details
Closed on
Jul 12, 2008
Sold by
Byrne Bridget and Durkin Deirdre K
Bought by
Watts Kathryn and Arbitman Steven
Current Estimated Value
Home Financials for this Owner
Home Financials are based on the most recent Mortgage that was taken out on this home.
Original Mortgage
$188,000
Outstanding Balance
$123,840
Interest Rate
6.49%
Estimated Equity
$284,752
Purchase Details
Closed on
Aug 15, 2005
Sold by
Kelley Julie A and Heyer Julie A
Bought by
Durkin Deirdre K and Byrne Bridget
Home Financials for this Owner
Home Financials are based on the most recent Mortgage that was taken out on this home.
Original Mortgage
$48,000
Interest Rate
5.79%
Mortgage Type
Credit Line Revolving
Purchase Details
Closed on
Jul 30, 1996
Sold by
Gray David Stuart and Gray Becky Lee
Bought by
Kelley Julie A
Create a Home Valuation Report for This Property
The Home Valuation Report is an in-depth analysis detailing your home's value as well as a comparison with similar homes in the area
Home Values in the Area
Average Home Value in this Area
Purchase History
| Date | Buyer | Sale Price | Title Company |
|---|---|---|---|
| Watts Kathryn | $235,000 | None Available | |
| Durkin Deirdre K | $240,000 | -- | |
| Kelley Julie A | $117,200 | -- |
Source: Public Records
Mortgage History
| Date | Status | Borrower | Loan Amount |
|---|---|---|---|
| Open | Watts Kathryn | $188,000 | |
| Previous Owner | Durkin Deirdre K | $48,000 |
Source: Public Records
Tax History Compared to Growth
Tax History
| Year | Tax Paid | Tax Assessment Tax Assessment Total Assessment is a certain percentage of the fair market value that is determined by local assessors to be the total taxable value of land and additions on the property. | Land | Improvement |
|---|---|---|---|---|
| 2025 | $5,257 | $113,530 | $39,950 | $73,580 |
| 2024 | $5,257 | $113,530 | $39,950 | $73,580 |
| 2023 | $5,038 | $113,530 | $39,950 | $73,580 |
| 2022 | $4,877 | $113,530 | $39,950 | $73,580 |
| 2021 | $4,614 | $113,530 | $39,950 | $73,580 |
| 2020 | $4,548 | $113,530 | $39,950 | $73,580 |
| 2019 | $4,548 | $113,530 | $39,950 | $73,580 |
| 2018 | $4,548 | $113,530 | $39,950 | $73,580 |
| 2017 | $4,414 | $113,530 | $39,950 | $73,580 |
| 2016 | $4,370 | $113,530 | $39,950 | $73,580 |
| 2015 | $4,108 | $113,530 | $39,950 | $73,580 |
| 2014 | $4,108 | $113,530 | $39,950 | $73,580 |
Source: Public Records
Map
Nearby Homes
- 2637 Woodland Rd
- 2750 Turner Ave
- 2653 Barnes Ave
- 2806 Anzac Ave
- 1403 Birchwood Ave
- 1503 Lindbergh Ave
- 1422 High Ave
- 2933 Susquehanna Rd
- 1567 Lindbergh Ave
- 1371 Fitzwatertown Rd
- 2437 Patane Ave
- 1212 Duncan Dr
- 1585 Edgewood Ave
- 1521 Coulon Rd
- 2803 Lamott Ave
- 1155 Easton Rd
- 309 Woodside Cir
- 1625 Park Ave
- 3225 Burn Brae Dr
- 1430 Aubrey Ave
- 1287 Thompson Rd
- 1275 Thompson Rd
- 1278 Thompson Rd
- 1274 Thomson Rd
- 1278 Thomson Rd
- 1287 Thomson Rd
- 2732 Kruger Rd
- 1268 Thomson Rd
- 1267 Thompson Rd
- 1264 Thomson Rd
- 1301 Thomson Rd
- 1305 Thompson Rd
- 2738 Kruger Rd
- 1260 Thomson Rd
- 1256 Thompson Rd
- 1257 Thomson Rd
- 1305 Thomson Rd
- 1281 Nolen Rd
- 1275 Nolen Rd
- 1300 Thomson Rd