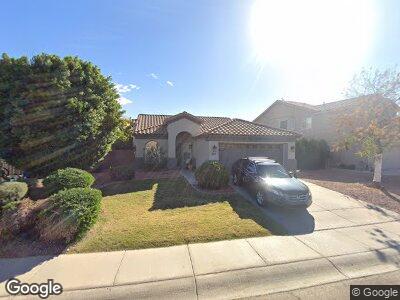
1283 W Morelos St Chandler, AZ 85224
Central Ridge NeighborhoodEstimated Value: $445,444 - $525,000
--
Bed
3
Baths
1,542
Sq Ft
$322/Sq Ft
Est. Value
About This Home
This home is located at 1283 W Morelos St, Chandler, AZ 85224 and is currently estimated at $496,861, approximately $322 per square foot. 1283 W Morelos St is a home located in Maricopa County with nearby schools including Conley Elementary School, Andersen Junior High School, and Hamilton High School.
Ownership History
Date
Name
Owned For
Owner Type
Purchase Details
Closed on
Oct 12, 2006
Sold by
Harris Frances A
Bought by
Harris Phillip D
Current Estimated Value
Home Financials for this Owner
Home Financials are based on the most recent Mortgage that was taken out on this home.
Original Mortgage
$170,997
Interest Rate
6.46%
Mortgage Type
New Conventional
Purchase Details
Closed on
Nov 12, 2001
Sold by
Steil Scott A and Steil Sharmon D
Bought by
Harris Phillip D
Home Financials for this Owner
Home Financials are based on the most recent Mortgage that was taken out on this home.
Original Mortgage
$151,050
Interest Rate
6.63%
Mortgage Type
New Conventional
Purchase Details
Closed on
Jun 10, 1996
Sold by
Richmond American Homes Inc
Bought by
Steil Scott A and Steil Sharmon D
Home Financials for this Owner
Home Financials are based on the most recent Mortgage that was taken out on this home.
Original Mortgage
$112,550
Interest Rate
8.01%
Mortgage Type
New Conventional
Create a Home Valuation Report for This Property
The Home Valuation Report is an in-depth analysis detailing your home's value as well as a comparison with similar homes in the area
Home Values in the Area
Average Home Value in this Area
Purchase History
| Date | Buyer | Sale Price | Title Company |
|---|---|---|---|
| Harris Phillip D | -- | Capital Title Agency Inc | |
| Harris Phillip D | $159,000 | Land Title Agency | |
| Steil Scott A | $118,511 | Old Republic Title Agency |
Source: Public Records
Mortgage History
| Date | Status | Borrower | Loan Amount |
|---|---|---|---|
| Open | Harris Phillip D | $162,722 | |
| Closed | Harris Phillip | $162,183 | |
| Closed | Harris Phillip D | $172,000 | |
| Closed | Harris Phillip D | $170,997 | |
| Closed | Harris Phillip D | $151,050 | |
| Previous Owner | Steil Scott A | $112,550 |
Source: Public Records
Tax History Compared to Growth
Tax History
| Year | Tax Paid | Tax Assessment Tax Assessment Total Assessment is a certain percentage of the fair market value that is determined by local assessors to be the total taxable value of land and additions on the property. | Land | Improvement |
|---|---|---|---|---|
| 2025 | $1,827 | $23,774 | -- | -- |
| 2024 | $1,789 | $22,642 | -- | -- |
| 2023 | $1,789 | $38,400 | $7,680 | $30,720 |
| 2022 | $1,726 | $27,770 | $5,550 | $22,220 |
| 2021 | $1,809 | $26,010 | $5,200 | $20,810 |
| 2020 | $1,801 | $24,120 | $4,820 | $19,300 |
| 2019 | $1,732 | $23,010 | $4,600 | $18,410 |
| 2018 | $1,677 | $21,360 | $4,270 | $17,090 |
| 2017 | $1,563 | $20,070 | $4,010 | $16,060 |
| 2016 | $1,506 | $18,900 | $3,780 | $15,120 |
| 2015 | $1,459 | $17,080 | $3,410 | $13,670 |
Source: Public Records
Map
Nearby Homes
- 874 S Comanche Ct
- 1313 W Glenmere Dr
- 1282 W Kesler Ln
- 515 S Apache Dr
- 1432 W Hopi Dr
- 1392 W Kesler Ln
- 972 S Gardner Dr
- 351 S Apache Dr
- 1254 W Browning Way
- 1360 W Folley St
- 530 S Emerson St
- 902 W Saragosa St Unit D23
- 231 S Comanche Dr
- 866 W Geronimo St
- 842 W Saragosa St
- 834 W Whitten St
- 1573 W Chicago St
- 850 W Folley St
- 1582 W Chicago St
- 1211 W Hawken Way
- 1283 W Morelos St
- 1293 W Morelos St
- 1273 W Morelos St
- 1313 W Morelos St Unit 1
- 1253 W Morelos St
- 1260 W Geronimo Place
- 1250 W Geronimo Place
- 1270 W Geronimo Place
- 1240 W Geronimo Place
- 1282 W Morelos St
- 1323 W Morelos St Unit 1
- 1292 W Morelos St
- 1272 W Morelos St
- 1302 W Morelos St
- 1280 W Geronimo Place
- 1262 W Morelos St
- 1312 W Morelos St
- 1230 W Geronimo Place
- 1252 W Morelos St
- 1233 W Morelos St Unit 1