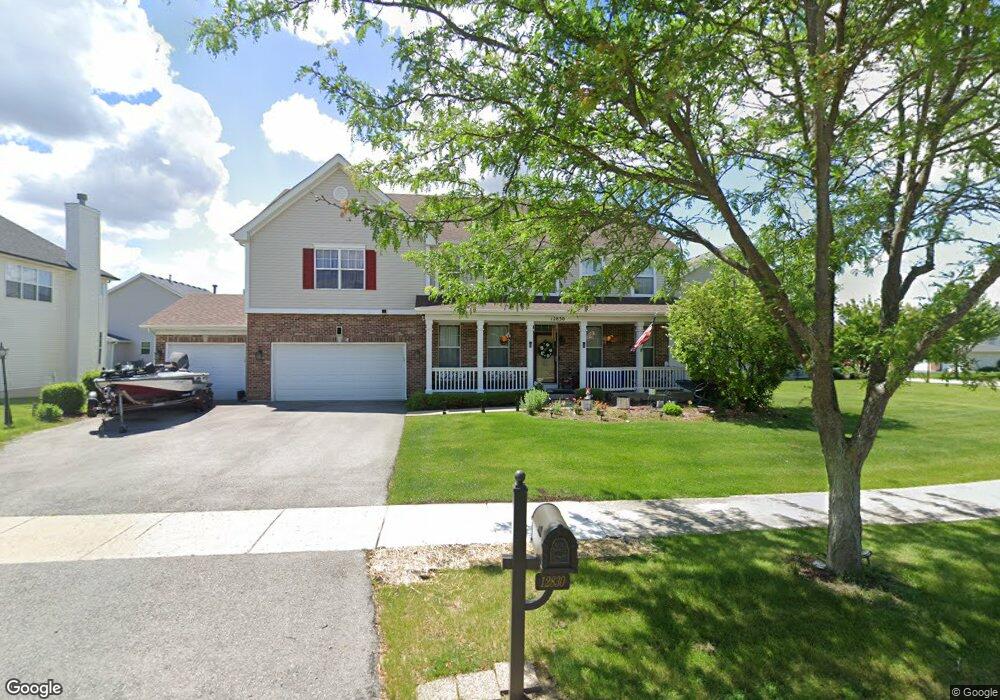
12830 Grande Poplar Cir Plainfield, IL 60585
Grande Park NeighborhoodEstimated Value: $548,000 - $616,000
4
Beds
3
Baths
3,214
Sq Ft
$179/Sq Ft
Est. Value
About This Home
This home is located at 12830 Grande Poplar Cir, Plainfield, IL 60585 and is currently estimated at $574,945, approximately $178 per square foot. 12830 Grande Poplar Cir is a home located in Kendall County with nearby schools including Grande Park Elementary School, Murphy Junior High School, and Oswego East High School.
Ownership History
Date
Name
Owned For
Owner Type
Purchase Details
Closed on
Jan 10, 2019
Sold by
Harrison Julie L and Jenkins Harold E
Bought by
Harrison Julie L and Jenkins Harold E
Current Estimated Value
Purchase Details
Closed on
Jan 21, 2010
Sold by
Fifth Third Bank
Bought by
Harrison Julie L
Home Financials for this Owner
Home Financials are based on the most recent Mortgage that was taken out on this home.
Original Mortgage
$228,000
Outstanding Balance
$151,583
Interest Rate
5.2%
Mortgage Type
New Conventional
Estimated Equity
$423,362
Purchase Details
Closed on
Oct 27, 2009
Sold by
Pasquinelli Huntercrest Llc
Bought by
Fifth Third Bank
Purchase Details
Closed on
Sep 15, 2004
Sold by
Mpi-1 Development Llc
Bought by
Pasquinelli Huntercrest Llc
Home Financials for this Owner
Home Financials are based on the most recent Mortgage that was taken out on this home.
Original Mortgage
$4,219,200
Interest Rate
5.95%
Mortgage Type
Construction
Create a Home Valuation Report for This Property
The Home Valuation Report is an in-depth analysis detailing your home's value as well as a comparison with similar homes in the area
Home Values in the Area
Average Home Value in this Area
Purchase History
| Date | Buyer | Sale Price | Title Company |
|---|---|---|---|
| Harrison Julie L | -- | None Available | |
| Harrison Julie L | $285,000 | Multiple | |
| Fifth Third Bank | -- | None Available | |
| Pasquinelli Huntercrest Llc | $4,320,000 | Chicago Title Insurance Co |
Source: Public Records
Mortgage History
| Date | Status | Borrower | Loan Amount |
|---|---|---|---|
| Open | Harrison Julie L | $228,000 | |
| Previous Owner | Pasquinelli Huntercrest Llc | $4,219,200 |
Source: Public Records
Tax History Compared to Growth
Tax History
| Year | Tax Paid | Tax Assessment Tax Assessment Total Assessment is a certain percentage of the fair market value that is determined by local assessors to be the total taxable value of land and additions on the property. | Land | Improvement |
|---|---|---|---|---|
| 2024 | -- | $160,520 | $31,020 | $129,500 |
| 2023 | $11,973 | $139,583 | $26,974 | $112,609 |
| 2022 | $11,973 | $128,058 | $24,747 | $103,311 |
| 2021 | $9,406 | $116,416 | $22,497 | $93,919 |
| 2020 | $9,406 | $111,939 | $21,632 | $90,307 |
| 2019 | $227 | $99,483 | $21,632 | $77,851 |
| 2018 | $9,099 | $97,247 | $21,146 | $76,101 |
| 2017 | $8,791 | $89,217 | $19,400 | $69,817 |
| 2016 | $9,506 | $94,725 | $24,670 | $70,055 |
| 2015 | $9,955 | $94,725 | $24,670 | $70,055 |
| 2014 | -- | $91,082 | $23,721 | $67,361 |
| 2013 | -- | $93,899 | $24,455 | $69,444 |
Source: Public Records
Map
Nearby Homes
- 12922 Grande Poplar Cir
- 12814 Grande Pines Blvd
- 13035 Grande Pines Blvd
- 12929 Alpine Way
- 26315 Elizabeth Ct
- 12811 Conifer St
- 26200 W Chatham Dr
- 12354 S Blue Water Pkwy
- 26536 W Red Apple Rd
- 870 Simons Rd
- 26414 Rustling Birch Way
- 26207 W Baxter Ct
- 13005 Timber Wood Cir
- 26205 Forrester Dr
- 12225 Sinclair Dr
- 26101 Forrester Dr
- 26244 W Sablewood Cir
- 12205 Sinclair Dr
- 26205 Stewart Ridge Dr
- 26005 W Forrester Dr
- 12834 Grande Poplar Cir
- 12826 Grande Poplar Cir
- 26607 Silverleaf Dr
- 12838 Grande Poplar Cir
- 12829 Grande Poplar Cir
- 12831 Grande Poplar Cir
- 26609 Silverleaf Dr
- 12825 Grande Poplar Cir
- 12833 Grande Poplar Cir
- 12835 Grande Poplar Cir
- 12842 Grande Poplar Cir
- 12837 Grande Poplar Cir
- 26604 Silverleaf Dr
- 12839 Grande Poplar Cir
- 26610 Silverleaf Dr
- 26611 Silverleaf Dr
- 12843 Grande Poplar Cir
- 26613 Silverleaf Dr
- 12818 Grande Poplar Cir
- 26616 Silverleaf Dr